
Page 91 - 2020 Annual Reports Book updated1_Neat
P. 91
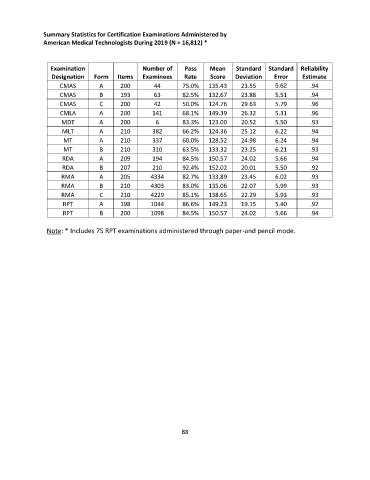
Summary Statistics for Certification Examinations Administered by
               American Medical Technologists During 2019 (N = 16,812) *


                  Examination                   Number of     Pass    Mean     Standard  Standard  Reliability
                  Designation   Form    Items   Examinees     Rate     Score   Deviation    Error    Estimate
                     CMAS         A      200        44       75.0%    135.43     23.55      5.62        .94
                     CMAS         B      193        63       82.5%    132.67     23.88      5.51        .94
                     CMAS         C      200        42       50.0%    124.76     29.63      5.79        .96
                     CMLA         A      200       141       68.1%    149.39     26.32      5.31        .96
                     MDT          A      200         6       83.3%    123.00     20.52      5.50        .93
                      MLT         A      210       382       66.2%    124.36     25.12      6.22        .94
                      MT          A      210       337       60.0%    128.52     24.98      6.24        .94
                      MT          B      210       310       63.5%    133.32     23.25      6.21        .93
                      RDA         A      209       194       84.5%    150.57     24.02      5.66        .94
                      RDA         B      207       210       92.4%    152.02     20.01      5.50        .92
                     RMA          A      205       4334      82.7%    133.89     23.45      6.02        .93
                     RMA          B      210       4303      83.0%    135.06     22.07      5.99        .93
                     RMA          C      210       4229      85.1%    138.65     22.29      5.93        .93
                      RPT         A      198       1044      86.6%    149.23     19.15      5.40        .92
                      RPT         B      200       1098      84.5%    150.57     24.02      5.66        .94


                 Note: * Includes 75 RPT examinations administered through paper-and pencil mode.


                                                                88