
Page 47 - 89326_NSAA_JournalSummer2019
P. 47
The average ski resort was open four more days this The generally positive snowfall across the country
winter than last, an encouraging finding that reflects both contributed to the success of the winter season, particularly
increased natural snowfall and ongoing investments in snow- for days of operation and downhill snowsports visits.
making infrastructure across the industry. Nationally, average snowfall per U.S. ski area was
Ski areas in the West had the longest seasons by average 232 inches, 31 percent ahead of the season prior but some-
number of operating days; however, one eastern region (the what below the 2016/17 season. Snowfall was down slightly
Northeast) averaged a higher number of days of operation in the Northeast, Southeast, and Pacific Northwest regions;
than one western region (the Pacific Northwest). The average however, snowfall was up in the Midwest; and up strongly
number days open per ski area was up in all regions except in the Rocky Mountains and Pacific Southwest regions.
the Midwest, where the figure dropped by three days. The In long-term perspective, relative to the 10-year average,
nation and all six regions were above their 10-year average snowfall was well above average this season in the Rocky
for days open. Mountains and Pacific Southwest regions; above average
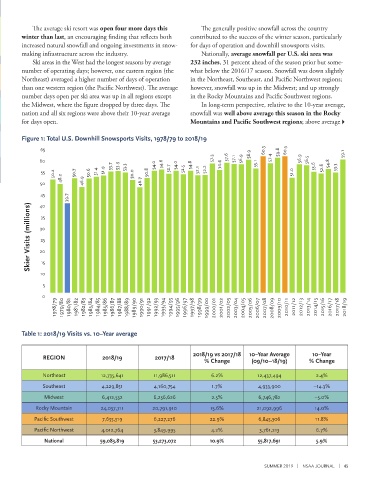
Figure 1: Total U.S. Downhill Snowsports Visits, 1978/79 to 2018/19
65 58.9 60.5 59.8 60.5 59.1
60 53.7 53.9 54.0 54.6 54.0 54.8 57.3 54.4 57.6 57.1 56.9 55.1 57.4 56.9 56.5 53.6 54.8
55 50.2 50.7 50.6 51.4 51.9 53.3 50.0 50.8 52.7 52.5 52.1 52.2 51.0 52.8 53.3
50 48.2 46.9 46.7
45
39.7
Skier Visits (millions) 20
40
35
30
25
15
10
5
0
1978/79 1979/80 1980/81 1981/82 1982/83 1983/84 1984/85 1985/86 1986/87 1987/88 1988/89 1989/90 1990/91 1991/92 1992/93 1993/94 1994/95 1995/96 1996/97 1997/98 1998/99 1999/00 2000/01 2001/02 2002/03 2003/04 2004/05 2005/06 2006/07 2007/08 2008/09 2009/10 2010/11 2011/12 2012/13 2013/14 2014/15 2015/16 2016/17 2017/18 2018/19
Table 1: 2018/19 Visits vs. 10–Year average
2018/19 vs 2017/18 10–Year Average 10–Year
REGION 2018/19 2017/18
% Change (09/10–18/19) % Change
Northeast 12,735,641 11,986,511 6.2% 12,437,494 2.4%
Southeast 4,229,851 4,160,754 1.7% 4,933,900 –14.3%
Midwest 6,412,532 6,256,626 2.5% 6,746,782 –5.0%
Rocky Mountain 24,037,711 20,791,910 15.6% 21,092,996 14.0%
Pacific Southwest 7,655,319 6,227,276 22.9% 6,845,306 11.8%
Pacific Northwest 4,012,764 3,849,995 4.2% 3,761,213 6.7%
National 59,083,819 53,273,072 10.9% 55,817,691 5.9%
SUMMER 2019 | NSAA JOURNAL | 45