
Page 48 - 89326_NSAA_JournalSummer2019
P. 48
in the Midwest and Northeast regions; and somewhat below somewhat lower. The least expensive tickets can be found
average in the Southeast and Pacific Northwest regions. in the Southeast and Midwest regions. By size grouping (as
Average adult weekend ticket price increased 9.2 measured by VTFH, or vertical transportation feet per hour),
percent this season to $131.38, up from $120.26. Ticket average adult weekend lift tickets were lowest at small ski
prices increased in all six geographic regions and in all four areas ($51.54) and highest at extra-large resorts ($151.06).
size categories. Average ticket prices were highest in the Total ticket yield, or ticket revenue divided by downhill
Rocky Mountains and Pacific Southwest, while average snowsports visits, is a metric that expresses the amount of
ticket prices in the Northeast and Pacific Northwest were ticket revenue that a ski area receives per skier visit, or the
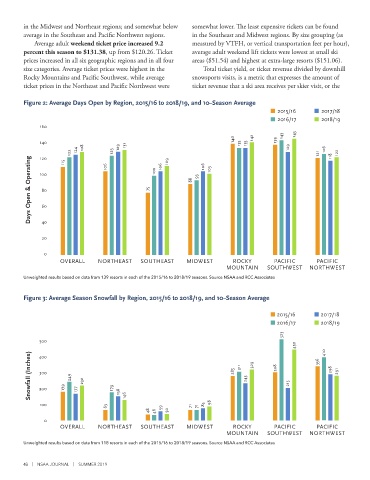
Figure 2: Average Days Open by Region, 2015/16 to 2018/19, and 10–Season Average
2015/16 2017/18
2016/17 2018/19
160
140 142 143 145
140 131 135 135 139
122 115 124 128 106 123 129 106 109 106 103 129 121 126 118 122
120
Days Open & Operating 100 75 100 88 93
80
60
40
20
0
OVERALL NORTHEAST SOUTHEAST MIDWEST ROCKY PACIFIC PACIFIC
MOUNTAIN SOUTHWEST NORTHWEST
Unweighted results based on data from 139 resorts in each of the 2015/16 to 2018/19 seasons. Source NSAA and RCC Associates
Figure 3: Average Season Snowfall by Region, 2015/16 to 2018/19, and 10–Season Average
2015/16 2017/18
2016/17 2018/19
523
500
450 410
Snowfall (Inches) 300 179 249 177 232 179 285 311 245 329 308 215 356 298 291
400
200
100 158 146 85 98
63 59 71 71
48 46 50
0
OVERALL NORTHEAST SOUTHEAST MIDWEST ROCKY PACIFIC PACIFIC
MOUNTAIN SOUTHWEST NORTHWEST
Unweighted results based on data from 118 resorts in each of the 2015/16 to 2018/19 seasons. Source NSAA and RCC Associates
46 | NSAA JOURNAL | SUMMER 2019