
Page 50 - 89326_NSAA_JournalSummer2019
P. 50
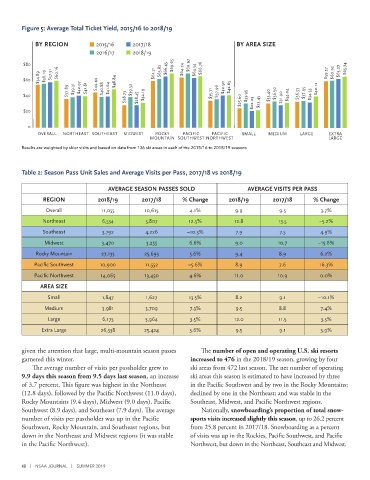
Figure 5: Average Total Ticket Yield, 2015/16 to 2018/19

             BY REGION           2015/16     2017/18                           BY AREA SIZE
                                 2016/17     2018/19

         $80                                            $66.45  $69.65  $64.74  $69.97  $64.54  $66.76             $65.74
              $54.89  $56.19  $57.31  $60.16        $61.71  $63.82                                           $59.57  $60.92  $63.27
         $60                     $44.44  $48.84
                       $37.89  $39.31  $42.97  $41.81  $40.88  $41.64  $39.32  $37.96  $42.50  $42.65     $40.12
         $40                               $28.73  $28.45  $32.19      $35.71    $25.60  $33.95  $23.45  $33.40  $36.50  $31.90  $34.04  $36.53  $37.95  $34.35

         $20                                                                         $22.03


          0
             OVERALL  NORTHEAST SOUTHEAST  MIDWEST  ROCKY     PACIFIC   PACIFIC  SMALL    MEDIUM    LARGE     EXTRA
                                                   MOUNTAIN SOUTHWEST NORTHWEST                               LARGE
        Results are weighted by skier visits and based on data from 136 ski areas in each of the 2015/16 to 2018/19 seasons


        Table 2: Season Pass Unit Sales and Average Visits per Pass, 2017/18 vs 2018/19

                                     AVERAGE SEASON PASSES SOLD                    AVERAGE VISITS PER PASS
               REGION            2018/19        2017/18      % Change        2018/19       2017/18       % Change

                Overall            11,055        10,615         4.1%           9.9           9.5           3.7%
               Northeast           6,534         5,807         12.5%           12.8          13.5          –5.2%
               Southeast           3,792         4,226         –10.3%          7.9           7.5           4.9%

                Midwest            3,470         3,255          6.6%           9.0           10.7         –15.6%
             Rocky Mountain        27,133        25,693         5.6%           9.4           8.9           6.2%
            Pacific Southwest     10,900         11,552        –5.6%           8.9           7.6           16.3%
            Pacific Northwest     14,065         13,450         4.6%           11.0          10.9          0.0%
              AREA SIZE

                 Small             1,847         1,627          13.5%          8.2           9.1          –10.1%
                Medium             3,981         3,709          7.3%           9.5           8.8           7.4%
                 Large             6,175         5,964          3.5%           12.0          11.5          3.5%

               Extra Large        26,338         25,424         3.6%           9.5           9.1           3.9%


        given the attention that large, multi-mountain season passes   The number of open and operating U.S. ski resorts
        garnered this winter.                                   increased to 476 in the 2018/19 season, growing by four
            The average number of visits per passholder grew to    ski areas from 472 last season. The net number of operating
        9.9 days this season from 9.5 days last season, an increase   ski areas this season is estimated to have increased by three
        of 3.7 percent. This figure was highest in the Northeast   in the Pacific Southwest and by two in the Rocky Mountains;
        (12.8 days), followed by the Pacific Northwest (11.0 days),   declined by one in the Northeast; and was stable in the
        Rocky Mountains (9.4 days), Midwest (9.0 days), Pacific   Southeast, Midwest, and Pacific Northwest regions.
        Southwest (8.9 days), and Southeast (7.9 days). The average    Nationally, snowboarding’s proportion of total snow-
        number of visits per passholder was up in the Pacific   sports visits increased slightly this season, up to 26.2 percent
        Southwest, Rocky Mountain, and Southeast regions, but   from 25.8 percent in 2017/18. Snowboarding as a percent
        down in the Northeast and Midwest regions (it was stable   of visits was up in the Rockies, Pacific Southwest, and Pacific
        in the Pacific Northwest).                              Northwest, but down in the Northeast, Southeast and Midwest.


        48  |  NSAA JOURNAL  |  SUMMER 2019