
Page 51 - 89326_NSAA_JournalSummer2019
P. 51
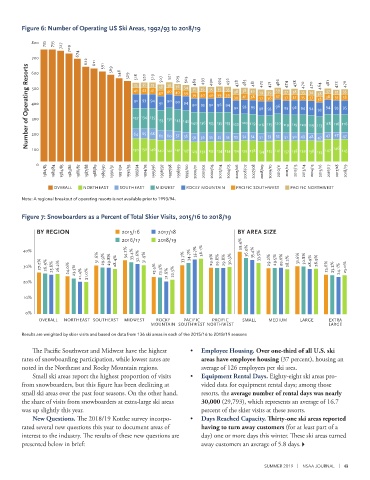
Figure 6: Number of Operating US Ski Areas, 1992/93 to 2018/19
800 735 735 727 709
700 674 622 611 591 569 546 529 518 520 519 507 521 509 503
Number of Operating Resorts 400 137 134 135 40 40 40 39 140 136 135 135 135 122 478 120 119 481 116 115 120 486 119 119 120 119 113 464 118 116 116 476
600
493
492
494
489
490
485
481
478
474
472
473
471
470
470
35
35
35
38
36
34
38
500
35
35
35
35
36
43
41
39
41
38
37
39
35
38
37
34
38
33
35
39
39
38
39 40 40 39
39
37
41
38
38
38
37
35
39
35
37
37
37
36
38
91
93 94
90 90 94
91
90 93 92 96 94
96
93 95
94
93 93
92
96 93
93 96 94 94
93
300
135 151 145 143
64 65 68
200
63 60 57
47
47 47
53
53
56
54
54
51
53
55
55
55
51
56
56
50 49 48 47
100
0 150 150 146 140 142 141 137 129 132 133 134 134 134 139 138 134 135 141 137 138 139 138 135 147 146 145
1982/83 1983/84 1984/85 1985/86 1986/87 1987/88 1988/89 1989/90 1990/91 1991/92 1992/93 1993/94 1994/95 1995/96 1996/97 1997/98 1998/99 1999/00 2000/01 2001/02 2002/03 2003/04 2004/05 2005/06 2006/07 2007/08 2008/09 2009/10 2010/11 2011/12 2012/13 2013/14 2014/15 2015/16 2016/17 2017/18 2018/19
OVERALL NORTHEAST SOUTHEAST MIDWEST ROCKY MOUNTAIN PACIFIC SOUTHWEST PACIFIC NORTHWEST
Note: A regional breakout of operating resorts is not available prior to 1993/94.
Figure 7: Snowboarders as a Percent of Total Skier Visits, 2015/16 to 2018/19
BY REGION 2015/16 2017/18 BY AREA SIZE
2016/17 2018/19 39.4%
40% 34.2% 35.7% 36.1% 36.0% 35.4%
31.6% 29.9% 29.8% 33.4% 32.6% 31.9% 33.7% 34.7% 29.9% 29.8% 29.8% 30.3% 33.5% 29.2% 29.5% 29.6% 31.6% 30.8% 28.9%
27.2% 28.4% 28.2% 28.9%
30% 26.9% 25.8% 26.2% 24.0% 23.3% 23.5% 23.3% 22.5% 25.6% 25.2% 24.1% 25.0%
20% 21.4% 21.0% 21.6%
10%
0%
OVERALL NORTHEAST SOUTHEAST MIDWEST ROCKY PACIFIC PACIFIC SMALL MEDIUM LARGE EXTRA
MOUNTAIN SOUTHWEST NORTHWEST LARGE
Results are weighted by skier visits and based on data from 136 ski areas in each of the 2015/16 to 2018/19 seasons
The Pacific Southwest and Midwest have the highest • Employee Housing. Over one-third of all U.S. ski
rates of snowboarding participation, while lowest rates are areas have employee housing (37 percent), housing an
noted in the Northeast and Rocky Mountain regions. average of 126 employees per ski area.
Small ski areas report the highest proportion of visits • Equipment Rental Days. Eighty-eight ski areas pro-
from snowboarders, but this figure has been declining at vided data for equipment rental days; among those
small ski areas over the past four seasons. On the other hand, resorts, the average number of rental days was nearly
the share of visits from snowboarders at extra-large ski areas 30,000 (29,793), which represents an average of 16.7
was up slightly this year. percent of the skier visits at these resorts.
New Questions. The 2018/19 Kottke survey incorpo- • Days Reached Capacity. Thirty-one ski areas reported
rated several new questions this year to document areas of having to turn away customers (for at least part of a
interest to the industry. The results of these new questions are day) one or more days this winter. These ski areas turned
presented below in brief: away customers an average of 5.8 days.
SUMMER 2019 | NSAA JOURNAL | 49