


Page 24 - 71187_NSAA_FallJournal2016
P. 24
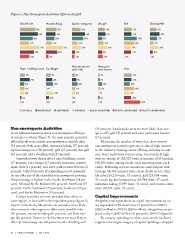
Figure 5: Non-Snowsports Activities Offered, 2015/16

Chairlift rides    Mountain biking                          Zip line / canopy tour  Disc golf          Golf                          Climbing Wall

        54%                                  37%                         30%                   24%                 27%                         23%
            63%                             34%                                46%             27%                 27%                              34%
                                           30%                                            15%
    45%                                20%                                   40%             20%                           45%                  25%
32%                                                                  20%                                              36%                  12%
                                                       61%                                        33%             23%
              70%                              40%                        33%             15%                     25%                             30%
      50%                          8%                            10%                                     0%                               10%
33%                                                               8%                         17%                                       0%

Ropes / challenge course Euro Bungee                        Mountain coaster /      Water park /       None
                                                            alpine slide            water features
      17%                17%                                                                                       27%
            34%            22%                                   11%                   6%                          27%
                             25%                                  15%                  5%                       20%
     15%
      16%          0%                                                20%                   15%                        36%
     14%                     26%                                  12%                   8%                      19%
 5%                                                              12%                  2%
0%                     10%                                   0%                        5%                         25%
                   0%                                        0%                      0%                                         58%

OVERALL          NORTHEAST         SOUTHEAST                MIDWEST ROCKY MOUNTAIN PACIFIC SOUTHWEST PACIFIC NORTHWEST

Non-snowsports Activities                                                           (34 percent). Southeast ski areas are more likely than aver-
                                                                                    age to offer golf (45 percent) and water park/water features
In an additional question about non-snowsports offerings                            (15 percent).
in summer or winter (figure 5), the most popular amenities
offered by ski areas include non-snowsports chairlift rides                             Measuring the number of visits that these various
(54 percent of ski areas offer), mountain biking (37 percent),                      non-snowsports activities generate is also of high interest
zip line/canopy tour (30 percent), golf (27 percent), disc golf                     in the industry. Among resorts offering activities in sum-
(24 percent), and a climbing wall (23 percent).                                     mer, water park/water feature usage is particularly high,
                                                                                    with an average of 182,027 visits in summer 2015 (median
    Somewhat lower shares offer a ropes/challenge course                            150,296 visits, among six ski areas reporting water park
(17 percent), Euro bungee (17 percent), mountain coaster/                           visits). Following next are mountain coaster/alpine slide
alpine slide (11 percent), and water park or water features (6                      (average 64,394 summer visits across 16 ski areas), chair-
percent). Only 27 percent of responding resorts nationally                          lift rides (24,210 visits, 73 resorts), golf (23,004 visits,
do not offer any of the identified non-snowsports activities;                       33 areas), zip line/canopy tour (10,744 visits, 37 areas),
this percentage is highest in the Pacific Northwest (58 per-                        mountain biking (7,939 visits, 51 areas), and various other
cent), followed by the Midwest (36 percent), Northeast (27                          visits (18,331 visits, 53 areas).
percent), Pacific Southwest (25 percent), Southeast (20 per-
cent), and Rocky Mountains (19 percent).                                            Capital Improvements

    Certain amenities are more prevalent than others in                             Altogether, total expenditures on capital improvements by sur-
some regions, at least within the respondent group (figure 5).                      vey respondents (138 resorts) rose 17 percent from 2014-15
Resorts in the Rocky Mountains are somewhat more likely                             ($262 million) to 2015-16 ($306 million), though they are pro-
than resorts in other regions to offer scenic chairlift rides                       jected to dip to $287 million (-6 percent) in 2016-17 (figure 6).
(70 percent), mountain biking (61 percent), and Euro bun-
gee (26 percent). Resorts in the Northeast are most likely to                           By category, spending on other on-mountain facilities/
offer zip line/canopy tour (46 percent) and a climbing wall                         support—the largest category of capital spending—dropped

22  |  NSAA JOURNAL  |  FALL 2016

