


Page 25 - 71187_NSAA_FallJournal2016
P. 25
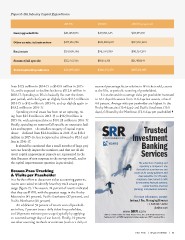
Figure 6: Ski Industry Capital Expenditures

New/upgraded lifts            2014/15                           2015/16       2016/17 (projected)
                              $41,484,926                       $41,960,645   $43,185,110
                                                                $149,800,682  $112,565,600
Other on-mtn. infrastructure  $172,916,796                      $96,534,939   $110,154,134
                                                                $18,155,113   $21,408,141
Real estate                   $24,838,746                       $306,451,379  $287,312,985

Summer/fall specific          $22,753,355

Total Capital Expenditures    $261,993,823

from $173 million in 2014-15 to $149.8 million in 2015-         seasonal percentage factor relative to lift tickets sold, counts
16, and is expected to decline further to $112.6 million in     at the lifts, or periodic scanning of passholders).
2016-17. Spending on lifts is basically flat over the three-
year period, with the figure up slightly from $41.5 million in      It is estimated that average visits per passholder increased
2014-15 to $42 million in 2015-16, and up slightly again to     to 12.1 days this season from 11.6 days last season, a rise of
$43.2 million in 2016-17.                                       4.6 percent. Average visits per passholder are highest in the
                                                                Rocky Mountains (13.4 days) and Pacific Southwest (13.5
    Spending on real estate has been on an upswing, ris-        days), followed by the Northeast (12.6 days per passholder)
ing from $24.8 million in 2014-15 to $96.50 million in
2015-16, with a projected rise to $110.28 million in 2016-17.                    Trusted
Finally, spending on summer/fall-specific on-mountain facil-                  Investment
ities and support—the smallest category of capital expen-
diture—declined from $22.8 million in 2014-15 to $18.2                          SBearnvkicinegs
million in 2015-16, but is expected to rebound to $21.4 mil-
lion in 2016-17.                                                                   The adventure of owning and
                                                                                    operating a company is one
    It should be cautioned that a small number of large proj-                   that calls for a partner you can
ects can heavily impact the numbers, and that not all ski                     count on for strong guidance and
resort capital improvement projects are represented in the                         deep expertise. For 25 years,
data (because of non-response to the survey overall, and to                     companies have turned to SRR
the capital improvements question in particular).                               for innovative financial advisory,

Season Pass Tracking                                                                   capital markets, financial
& Visits per Passholder                                                       planning, and valuation solutions.

In a further effort to document ticket accounting patterns,                   For more information, contact:
resorts were asked to identify how they track season pass
usage (figure 7). This season, 24 percent of resorts indicated                Joshua J. Fox, Managing Director
that they use RFID, with the greatest usage in the Rocky
Mountains (41 percent), Pacific Southwest (37 percent), and                                +1.646.807.4232
Pacific Northwest (30 percent).
                                                                              www.SRR.com          jfox@srr.com
    An additional 32 percent of resorts scan all passhold-
ers in line, 7 percent issue a daily ticket for passholders,    SRR is a trade name for Stout Risius Ross, Inc. and Stout Risius Ross
and 28 percent estimate pass usage (typically by applying       Advisors, LLC, a FINRA registered broker-dealer and SIPC member firm.
an assumed average days of use factor). Finally, 10 percent
use other counting methods or estimates (such as a daily or

                                                                              FALL 2016  |  NSAA JOURNAL  |  23

