


Page 26 - 71187_NSAA_FallJournal2016
P. 26
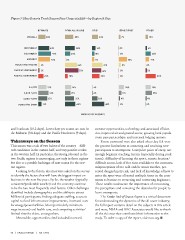
Figure 7: How Resorts Track Season Pass Usage 2015/16—by Region & Size

                        ESTIMATE        SCAN ALL IN LINE         RFID                 ISSUE TICKET     OTHER
                                                     32%                  24%            7%                10%
OVERALL                  28%
                                                                                      0%                 6%
NORTHEAST                          43%         38%                 14%                 0%                      20%
                                        20%                      10%
SOUTHEAST                          43%                           9%                               32%        14%
                                                                                         8%            0%
                MIDWEST            46%  0%                                   41%       0%               5%
ROCKY MOUNTAINS 5%                         10%                             37%         0%
                                                46%                      30%                                          40%
PACIFIC SOUTHWEST 5%                              53%                                         20%
                                                                                          11%                  20%
PACIFIC NORTHWEST        20%                                                            4%                      25%
                                                                                       0%
               0 2,999        32%       24%                      4%                                     4%
        3,000 5,999              32%    21%                      4%                                    0%
        6,000 11,999
12,000 AND OVER                35%           35%                       22%
                        13%                    40%                               48%

                                                    PERCENT OF RESORTS

and Southeast (10.2 days). Lower days per season are seen in     summer opportunities, technology and associated efficien-
the Midwest (9.8 days) and the Pacific Northwest (9 days).       cies, improved air and ground access, growing local popula-
                                                                 tions, pass partnerships, and increased lodging options.
Takeaways on the Season
                                                                     Resort personnel were also asked what they felt were
This season was a tale of two halves of the country—diffi-       the greatest limitations to attracting and retaining new
cult conditions in the eastern half, and very positive results   participants to snowsports. Cost/price point of entry, not
in the western half. In particular, the strong rebound in the    enough beginner teaching terrain (especially during peak
two Pacific regions is encouraging, not only in those regions    times), difficulty of learning the sport, remote location/
but also as a possible harbinger of next season for the east-    difficult access, lack of free time available to the customer,
ern regions.                                                     misperceptions of too cold and/or warm weather, per-
                                                                 ceived danger/injury risk, and lack of knowledge of how to
    Looking to the future, ski areas were asked on the survey    enter the sport were all noted multiple times in the com-
to identify the factors that will have the biggest impact on     ments as barriers to attracting and converting beginners.
business in the next five years. By far, the weather (typically  These results underscore the importance of overcoming
consistent/predictable weather) and the economy continue         the perceptions and removing the obstacles for people to
to be the two most frequently cited factors. Other challenges    learn snowsports.
identified include demographics and the ability to attract
Millennial participants, finding adequate staffing, access to        The Kottke End-of-Season Report is a critical document
capital to fund infrastructure improvements, increased costs     for understanding the dynamics of the ski resort industry;
for energy/power/utilities, labor (particularly minimum          the full report contains detail on the subjects in this article
wage increases) and health care, and competing activities/       and more. NSAA and RRC Associates would like to thank
limited time for skiers, among others.                           all the ski areas that contributed their information to the
                                                                 study. To order a copy of the report, visit nsaa.org.
    Meanwhile, opportunities cited included increased

24  |  NSAA JOURNAL  |  FALL 2016

