


Page 21 - 71187_NSAA_FallJournal2016
P. 21
30.3 percent), Northeast (down 29.9 percent), and Midwest The reduction in the total number of operating ski areas is
(down 21.0 percent). impacted, in part, by mergers of adjacent ski areas, effectively
combining two resorts into one. Additionally, some ski areas
Number of Operating Ski Areas have closed and others re-opened in the recent past, contributing
to the fluctuation in the total number of operating US ski areas.
The number of open and operating US ski resorts is an
indicator of the overall health of the industry. This figure Snowfall & Days Open
dipped to 463 from 470 each of the past two seasons. The
net number of operating ski areas this season is estimated The 2015-16 season was a very difficult one in terms of
to have increased by four in the Pacific Northwest, held weather and snow in the eastern half of the country, whereas
steady in the Pacific Southwest, declined by one each in the conditions were much more favorable in the western half.
Rocky Mountains and Southeast, declined by three in the On an overall national basis, average inches of snowfall
Northeast, and by six in the Midwest. at US resorts rebounded to an average of 171 inches per
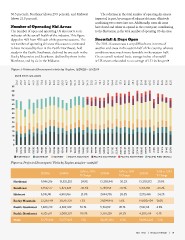
Figure 1: Estimated Snowsports visits by Region, 1978/79 – 2015/16
SKIER VISITS MILLIONS
65 50.2
60 48.2
55 39.7
50 50.7
45 46.9
40 50.6
35 51.4
30 51.9
25 53.7
20 53.9
15 53.3
10 50.0
46.7
5 50.8
0 54.0
54.6
52.7
54.0
52.5
54.1
52.1
52.2
57.3
54.4
57.6
57.1
56.9
58.9
55.1
60.5
57.4
59.8
60.5
51.0
56.9
56.5
53.6
52.8
1978/79
1979/80
1980/81
1981/82
1982/83
1983/84
1984/85
1985/86
1986/87
1987/88
1988/89
1989/90
1990/91
1991/92
1992/93
1993/94
1994/95
1995/96
1996/97
1997/98
1998/99
1999/00
2000/01
2001/02
2002/03
2003/04
2004/05
2005/06
2006/07
2007/08
2008/09
2009/10
2010/11
2011/12
2012/13
2013/14
2014/15
2015/16
NORTHEAST SOUTHEAST MIDWEST ROCKY MOUNTAIN PACIFIC SOUTHWEST PACIFIC NORTHWEST PACIFIC WEST TOTAL
Figure 2: Projected Snowsports Visits by Region 2012/13 – 2015/16
2015/16 2014/15 15/16 vs. 14/15 2013/14 15/16 vs. 13/14 2012/13 15/16 vs. 12/13
% Change % Change % Change
-29.9% 13,385,941 -30.2%
Northeast 9,346,316 13,332,252 -30.3% 5,769,158 -31.4% 13,333,572 -29.9%
5,673,328 -21.0% 7,694,705 -28.3%
Southeast 3,956,577 6,981,766 7.3% 21,099,945 5.6% 5,155,138 -23.2%
20,767,721 55.1% 5,154,112 45.1%
Midwest 5,515,741 4,822,329 110.3% 3,387,203 24.2% 7,273,465 -24.2%
2,000,229 -1.5% 56,491,064 -6.5%
Rocky Mountain 22,287,491 53,577,625 19,800,404 12.6%
Pacific Southwest 7,480,210 7,140,141 4.8%
Pacific Northwest 4,205,611 4,201,508 0.1%
Total 52,791,946 56,904,228 -7.2%
FALL 2016 | NSAA JOURNAL | 19

