
Page 17 - Statistics presented by Dr. Sara Ismail Aborass
P. 17
9/8/2023
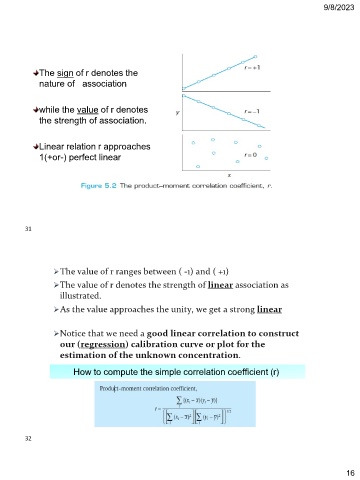
The sign of r denotes the
nature of association
while the value of r denotes
the strength of association.
Linear relation r approaches
1(+or-) perfect linear
31
The value of r ranges between ( -1) and ( +1)
The value of r denotes the strength of linear association as
illustrated.
As the value approaches the unity, we get a strong linear
Notice that we need a good linear correlation to construct
our (regression) calibration curve or plot for the
estimation of the unknown concentration.
How to compute the simple correlation coefficient (r)
32
16