
Page 19 - Statistics presented by Dr. Sara Ismail Aborass
P. 19
9/8/2023
•Although correlation coefficients are simple to calculate, they are all too easily
misinterpreted. It must always be borne in mind that the use of r equation will
generate an r-value even if the data are patently non-linear in character.
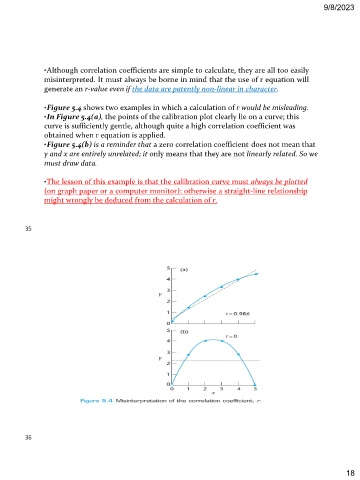
•Figure 5.4 shows two examples in which a calculation of r would be misleading.
•In Figure 5.4(a), the points of the calibration plot clearly lie on a curve; this
curve is sufficiently gentle, although quite a high correlation coefficient was
obtained when r equation is applied.
•Figure 5.4(b) is a reminder that a zero correlation coefficient does not mean that
y and x are entirely unrelated; it only means that they are not linearly related. So we
must draw data.
•The lesson of this example is that the calibration curve must always be plotted
(on graph paper or a computer monitor): otherwise a straight-line relationship
might wrongly be deduced from the calculation of r.
35
36
18