
Page 24 - Statistics presented by Dr. Sara Ismail Aborass
P. 24
9/8/2023
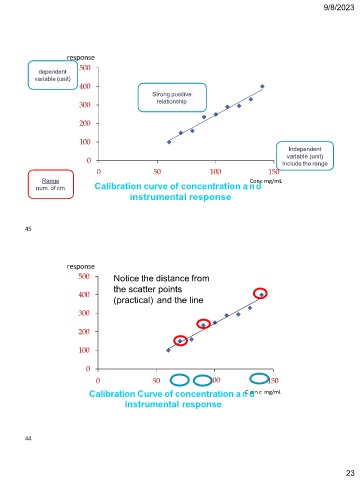
response
dependent 500
variable (unit) 400
300 Strong positive
relationship
200
100
Independent
0 variable (unit)
Include the range
0 50 100 150
Range Calibration curve of concentration a nCodnc mg/mL
num. of cm
instrumental response
45
response Notice the distance from
500 the scatter points
(practical) and the line
400
300
200
100
0
0 50 100 150
Calibration Curve of concentration a nC do n c mg/mL
instrumental response
44
23