
Page 21 - Statistics presented by Dr. Sara Ismail Aborass
P. 21
9/8/2023
How to draw Calibration (regression)
graphs in instrumental analysis
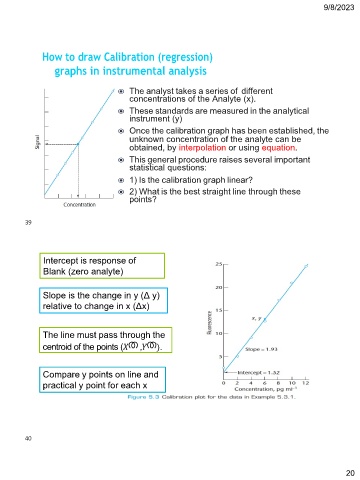
◉ The analyst takes a series of different
concentrations of the Analyte (x).
◉ These standards are measured in the analytical
instrument (y)
◉ Once the calibration graph has been established, the
unknown concentration of the analyte can be
obtained, by interpolation or using equation.
◉ This general procedure raises several important
statistical questions:
◉ 1) Is the calibration graph linear?
◉ 2) What is the best straight line through these
points?
39
Intercept is response of
Blank (zero analyte)
Slope is the change in y (Δ y)
relative to change in x (Δx)
The line must pass through the
centroid of the points ( ത , ത).
Compare y points on line and
practical y point for each x
40
20