
Page 524 - Atlas Sea Birds Ver1
P. 524
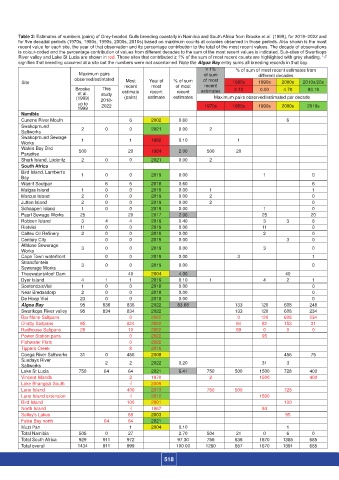
Table 2: Estimates of numbers (pairs) of Grey-headed Gulls breeding coastally in Namibia and South Africa from Brooke et al. (1999), for 2018–2022 and
             for five decadal periods (1970s, 1980s, 1990s, 2000s, 2010s) based on maximum counts at colonies observed in those periods. Also shown is the most
             recent value for each site, the year of that observation and its percentage contribution to the total of the most recent values. The decade of observations
             is colour-coded and the percentage contribution of values from different decades to the sum of the most recent values is indicated. Sub-sites of Swartkops
             River valley and Lake St Lucia are shown in red. Those sites that contributed ≥ 1% of the sum of most recent counts are highlighted with grey shading. ‘√’
             signifies that breeding occurred at a site but the numbers were not ascertained. Note the Algoa Bay entry sums all breeding records in that bay.
                                                                               ≥ 1%       % of sum of most recent estimates from
                                   Maximum pairs                               of sum             different decades
                                 observed/estimated                           of most
                                                   Most
                Site                               recent   Year of   % of sum   recent   1980s   1990s   2000s  2010s/20s
                                                                     of most
                                                            most
                                 Brooke    This                               estimates  2.10     0.00    4.70     93.19
                                  et al.   study   estimate   recent   recent
                                  (1999)  2018-    (pairs)  estimate  estimates   Maximum pairs observed/estimated per decade
                                  up to    2022                                1970s     1980s    1990s   2000s    2010s
                                  1999
              Namibia
              Cunene River Mouth                    6       2002      0.60                                  6
              Swakopmund            2       0       0       2021      0.00      2
              Saltworks
              Swakopmund Sewage     1               1       1982      0.10                1
              Works
              Walvis Bay Bird      500              20      1984      2.00      500       20
              Paradise
              Shark Island, Lüderitz  2     0       0       2021      0.00      2
              South Africa
              Bird Island, Lambert's
              Bay                   1       0       0       2019      0.00                         1                 0
              Wadrif Soutpan                6       6       2018      0.60                                           6
              Malgas Island         1       0       0       2019      0.00      1                                    1
              Marcus Island         2       0       0       2019      0.00      2                                    0
              Jutten Island         2       0       0       2019      0.00      2                                    0
              Schaapen Island       1       0       0       2019      0.00                         1                 0
              Paarl Sewage Works   25               20      2017      2.00                         25               20
              Robben Island         3       4       4       2019      0.40                         3        3        8
              Rietvlei             11       0       0       2019      0.00                         11                0
              Caltex Oil Refinery   2       0       0       2019      0.00                         2                 0
              Century City                  0       0       2019      0.00                                  3        0
              Athlone Sewerage      3       0       0       2019      0.00                         3                 0
              Works
              Cape Town waterfront          0       0       2019      0.00                3                          1
              Strandfontein         3       0       0       2019      0.00                                           0
              Sewerage Works
              Theewaterskloof Dam                   40      2004      4.00                                 40
              Dyer Island           4       1       1       2019      0.10      1                  4        2        1
              SoetendalsVlei        1       0       0       2018      0.00                                           0
              Near Bredasdorp       2       0       0       2018      0.00                                           0
              De Hoop Vlei         23       0       0       2018      0.00                                           0
              Algoa Bay            95      836      836     2022     83.68               133      120      608      248
              Swartkops River valley  95   834      834     2022                         133      120      608      234
              Bar None Saltpans                     0       2022                          0       120      608      234
              Chatty Saltpans      95               824     2022                          64       82      153      31
              Redhouse Saltpans    28               10      2022                          69       0        0        0
              Power Station pans                    0       2022                                   95
              Fishwater Flats                       0       2022
              Tippers Creek                         8       2016
              Coega River Saltworks  31     0       456     2008                                           456      75
              Sundays River                 2       2       2022      0.20                         31       3
              Saltworks
              Lake St Lucia        750     64       64      2021      6.41      750      500      1500     728      400
              Vincent Islands                       2       1970                2                 1500              400
              Lake Bhangazi South                   √       2009
              Lane Island                           400     2013                750      500               728
              Lane Island extension                 √       2012                                  1500
              Bird Island                           100     2001                                           100
              North Island                          √       1967                                   94
              Selley's Lakes                        68      2003                                           95
              False Bay north              64       64      2021
              Muzi Pan                              1       2004      0.10                                  1
              Total Namibia        505      0       27                2.70      504       21       0        6        0
              Total South Africa   929     911      972              97.30      756      636      1670    1385      685
              Total overall       1434     911      999              100.00    1260      657      1670    1391      685

                                                                 518