
Page 45 - 4. Pre-Course Reading-Training on Forestry Audit 2019
P. 45
Appendix 2: Using GIS and GPS in Forests Audits
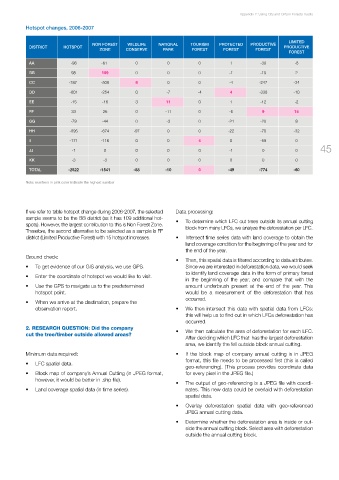
Hotspot changes, 2006-2007
LIMITED
NON FOREST WILDLIFE NATIONAL TOURISM PROTECTED PRODUCTIVE
DISTRICT HOTSPOT PRODUCTIVE
ZONE CONSERVE PARK FOREST FOREST FOREST
FOREST
AA -98 -61 0 0 0 1 -30 -8
BB 95 109 0 0 0 -1 -15 2
CC -787 -508 6 0 0 -4 -247 -34
DD -601 -254 0 -7 -4 4 -330 -10
EE -15 -16 3 11 0 1 -12 -2
FF 33 26 0 -11 0 -6 9 15
GG -79 -44 0 -3 0 -21 -20 9
HH -895 -674 -97 0 0 -22 -70 -32
II -171 -116 0 0 4 0 -59 0
45
JJ -1 0 0 0 0 -1 0 0
KK -3 -3 0 0 0 0 0 0
TOTAL -2522 -1541 -88 -10 0 -49 -774 -60
Note: numbers in pink color indicate the highest number
If we refer to table hotspot change during 2006-2007, the selected Data processing:
sample seems to be the BB district (as it has 109 additional hot- • To determine which LFC cut trees outside its annual cutting
spots). However, the largest contribution to this is Non Forest Zone. block from many LFCs, we analyze the deforestation per LFC.
Therefore, the second alternative to be selected as a sample is FF
district (Limited Productive Forest) with 15 hotspot increases. • Intersect time series data with land coverage to obtain the
land coverage condition for the beginning of the year and for
the end of the year.
Ground check:
• Then, this spatial data is filtered according to data attributes.
• To get evidence of our GIS analysis, we use GPS. Since we are interested in deforestation data, we would seek
to identify land coverage data in the form of primary forest
• Enter the coordinate of hotspot we would like to visit.
in the beginning of the year, and compare that with the
• Use the GPS to navigate us to the predetermined amount underbrush present at the end of the year. This
hotspot point. would be a measurement of the deforestation that has
occurred.
• when we arrive at the destination, prepare the
observation report. • we then intersect this data with spatial data from LFCs;
this will help us to find out in which LFCs deforestation has
occurred.
2. RESEARCH QUESTION: Did the company • we then calculate the area of deforestation for each LFC.
cut the tree/timber outside allowed areas?
After deciding which LFC that has the largest deforestation
area, we identify the fell outside block annual cutting.
Minimum data required: • If the block map of company annual cutting is in JPEG
format, this file needs to be processed first (this is called
• LFC spatial data.
geo-referencing). (This process provides coordinate data
• Block map of company’s Annual Cutting (in JPEG format, for every pixel in the JPEG file.)
however, it would be better in .shp file).
• The output of geo-referencing is a JPEG file with coordi-
• Land coverage spatial data (in time series). nates. This new data could be overlaid with deforestation
spatial data.
• Overlay deforestation spatial data with geo-referenced
JPEG annual cutting data.
• Determine whether the deforestation area is inside or out-
side the annual cutting block. Select area with deforestation
outside the annual cutting block.