Page 46 - 4. Pre-Course Reading-Training on Forestry Audit 2019
P. 46

Auditing Forests: Guidance for Supreme Audit Institutions

          The following are examples of the output:            3. RESEARCH QUESTION: Has illegal
                                                               deforestation occurred in the national park,
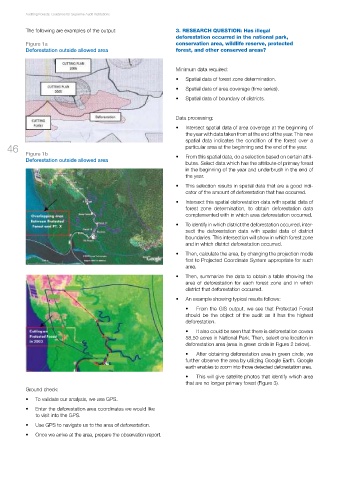
          Figure 1a                                            conservation area, wildlife reserve, protected
          Deforestation outside allowed area                   forest, and other conserved areas?


                                                               Minimum data required:
                                                               •   Spatial data of forest zone determination.
                                                               •   Spatial data of area coverage (time series).
                                                               •   Spatial data of boundary of districts.


                                                               Data processing:
                                                               •   Intersect spatial data of area coverage at the beginning of
                                                                  the year with data taken from at the end of the year. This new
                                                                  spatial  data  indicates  the  condition  of  the  forest  over  a
    46                                                            particular area at the beginning and the end of the year.
          Figure 1b                                            •   From this spatial data, do a selection based on certain attri-
          Deforestation outside allowed area
                                                                  butes. Select data which has the attribute of primary forest
                                                                  in the beginning of the year and underbrush in the end of
                                                                  the year.
                                                               •   This selection results in spatial data that are a good indi-
                                                                  cator of the amount of deforestation that has occurred.
                                                               •   Intersect this spatial deforestation data with spatial data of
                                                                  forest  zone  determination,  to  obtain  deforestation  data
                                                                  complemented with in which area deforestation occurred.
                                                               •   To identify in which district the deforestation occurred, inter-
                                                                  sect  the  deforestation  data  with  spatial  data  of  district
                                                                  boundaries. This intersection will show in which forest zone
                                                                  and in which district deforestation occurred.
                                                               •   Then, calculate the area, by changing the projection mode
                                                                  first to Projected Coordinate System appropriate for such
                                                                  area.
                                                               •   Then, summarize the data to obtain a table showing the
                                                                  area  of  deforestation  for  each  forest  zone  and  in  which
                                                                  district that deforestation occurred.
                                                               •   An example showing typical results follows:
                                                                  •   From the GIS output, we see that Protected Forest
                                                                  should  be  the  object  of  the  audit  as  it  has  the  highest
                                                                  deforestation.
                                                                  •   It also could be seen that there is deforestation covers
                                                                  58,50 acres in National Park. Then, select one location in
                                                                  deforestation area (area in green circle in Figure 2 below).
                                                                  •   After obtaining deforestation area in green circle, we
                                                                  further observe the area by utilizing Google Earth. Google
                                                                  earth enables to zoom into those detected deforestation area.
                                                                  •   This will give satellite photos that identify which area
                                                                  that are no longer primary forest (Figure 3).
          Ground check:
          •   To validate our analysis, we use GPS.
          •   Enter the deforestation area coordinates we would like
             to visit into the GPS.
          •   Use GPS to navigate us to the area of deforestation.

          •   Once we arrive at the area, prepare the observation report.
   41   42   43   44   45   46   47   48   49   50   51