
Page 445 - Corporate Finance PDF Final new link
P. 445
NPP
BRILLIANT’S Capital Budgeting 445
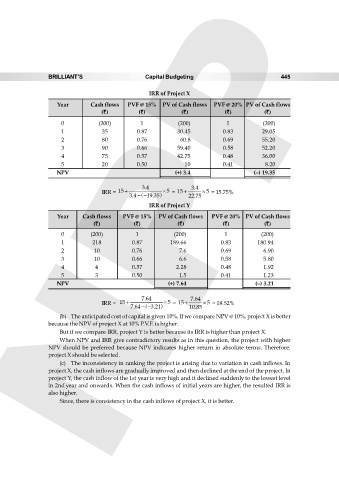
IRR of Project X
Year Cash flows PVF @ 15% PV of Cash flows PVF @ 20% PV of Cash flows
(`) (`) (`) (`) (`)
0 (200) 1 (200) 1 (200)
1 35 0.87 30.45 0.83 29.05
2 80 0.76 60.8 0.69 55.20
3 90 0.66 59.40 0.58 52.20
4 75 0.57 42.75 0.48 36.00
5 20 0.50 10 0.41 8.20
NPV (+) 3.4 (–) 19.35
3.4 3.4
IRR = 15 5 = 15 5 = 15.75%
3.4 19.35 22.75
IRR of Project Y
Year Cash flows PVF @ 15% PV of Cash flows PVF @ 20% PV of Cash flows
(`) (`) (`) (`) (`)
0 (200) 1 (200) 1 (200)
1 218 0.87 189.66 0.83 180.94
2 10 0.76 7.6 0.69 6.90
3 10 0.66 6.6 0.58 5.80
4 4 0.57 2.28 0.48 1.92
5 3 0.50 1.5 0.41 1.23
NPV (+) 7.64 (–) 3.21
7.64 7.64
IRR = 15 5 = 15 5 = 18.52%
7.64 3.21 10.85
(b) The anticipated cost of capital is given 10%. If we compare NPV @ 10%, project X is better
because the NPV of project X at 10% P.V.F. is higher.
But if we compare IRR, project Y is better because its IRR is higher than project X.
When NPV and IRR give contradictory results as in this question, the project with higher
NPV should be preferred because NPV indicates higher return in absolute terms. Therefore,
project X should be selected.
(c) The inconsistency in ranking the project is arising due to variation in cash inflows. In
project X, the cash inflows are gradually improved and then declined at the end of the project. In
project Y, the cash inflow of the 1st year is very high and it declined suddenly to the lowest level
in 2nd year and onwards. When the cash inflows of initial years are higher, the resulted IRR is
also higher.
Since, there is consistency in the cash inflows of project X, it is better.