
Page 134 - Theoretical and Practical Interpretation of Investment Attractiveness
P. 134
2020 100 4,04 4,33 5,57 6,42 9,86 7,94 5,93 6,65 4,91 3,55 9,40 5,60 3,30 22,17
Table 3.4.1 2019 2018 100 100 4,47 5,44 3,80 3,79 5,29 7,74 4,03 2,90 12,49 13,30 9,01 8,52 6,17 6,57 5,24 5,68 Of 6,04 5.83 3,00 2,17 10,39 9,04 4,43 4,46 2,57 2,43 21,67 21,28
2017 100 3,91 4,14 16,10 2,48 15,49 0,06 4,97 6,08 4,92 2,26 8,23 4,09 3,02 18,81
2016 100 7,54 3,80 11,77 2,53 12,80 5,74 4,78 At 6.80 3,82 2,21 7,70 4,74 2,93 21,70
2015 100 14,22 3,99 9,28 2,64 13,42 4,04 4,72 6,85 3,92 2,40 9,73 5,12 3,22 16,45
2014 100 11,12 4,04 9,67 2,95 12,72 4,69 4,59 6,38 3,80 2,63 10,62 5,67 4,16 16,94
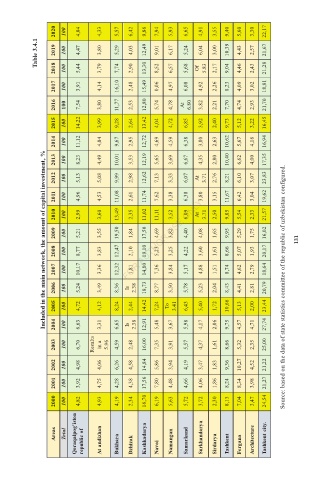
Included in the main network, the amount of capital investment, %
2013 100 8,23 4,49 10,01 3,53 12,19 5,65 3,69 6,67 4,35 2,80 10,40 6,62 4,00 17,35
2012 100 5,13 5,08 9,99 2,98 12,62 7,13 3,33 6,07 At 3.71 2,76 8,21 6,10 3,07 23,83
2011 100 4,96 4,53 11,08 2,61 11,74 7,62 3,38 6,38 3,80 3,15 11,67 6,42 3,04 19,62
2010 100 2,99 3,60 13,49 2,35 11,02 11,11 3,52 6,09 At 3.71 2,50 9,85 5,54 2,33 21,57
2009 100 5,21 3,55 19,50 1,84 17,50 4,69 3,82 4,40 4,08 1,65 9,95 5,29 1,75 16,02 131
2008 100 8,77 3,83 12,47 2,10 19,10 5,23 3,25 4,22 3,60 1,61 8,66 5,07 1,93 20,17
2007 100 10,17 3,36 12,32 1,81 14,80 7,36 3,84 5,17 4,88 1,51 8,74 4,62 2,79 18,64
2006 100 5,24 3,49 8,36 Is 2.38 18,73 8,77 3,50 5,78 5,23 2,04 8,43 4,41 2,81 20,79 Source: based on the data of state statistics committee of the republic of uzbekistan configured.
2005 100 4,72 4,12 8,24 2,44 14,42 7,24 To 3.41 6,43 5,40 1,72 10,66 5,13 2,00 23,44
2004 100 6,63 3,31 6,65 Is 2.38 12,91 5,48 3,67 5,98 4,17 2,06 9,75 4,57 4,71 27,74
2003 100 6,70 Results in a 5.96 4,59 2,48 16,00 7,35 3,91 5,57 4,37 1,61 8,66 5,32 2,35 25,00
2002 100 4,98 4,06 6,26 4,58 14,84 5,86 3,94 4,19 3,47 1,83 9,36 10,27 4,52 21,22
2001 100 3,92 4,75 4,28 4,38 17,56 7,80 4,48 4,66 4,06 1,86 8,24 8,34 3,98 21,27
2000 100 4,82 4,93 4,19 2,34 16,70 6,19 5,63 5,72 3,72 2,30 8,13 7,04 3,47 24,54
Qoraqalpog'iston republic of At andizhan Bukhara Dzhizak Kashkadarya Navoi Namangan Samarkand Surkhandarya Sirdarya Tashkent Fergana Architecture Tashkent city.
Areas Total