
Page 156 - Theoretical and Practical Interpretation of Investment Attractiveness
P. 156
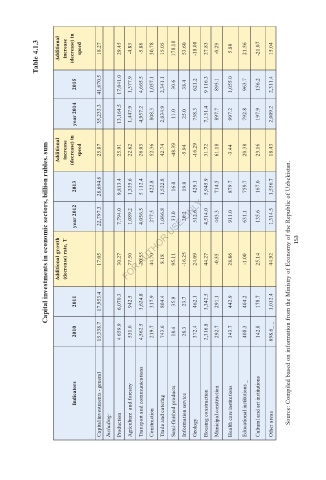
Table 4.1.3   Additional   increase   (decrease) in   speed         18.27      29.45   -4.83   -5.88   30.78   15.05   178.18   53.60   -18.08   27.83   -0.29   5.80   21.56   -21.07   15.04


                     2015   41,670.5      17,041.0   1,377.9   4,665.5   1,057.1   2,341.1   30.6   38.4   621.2   9 116.3   895.1   1,055.0   963.7   156.2   2,311.4


                     year 2014   35,233.3      13,164.5   1,447.9   4,957.2   808.3   2,034.9   11.0   25.0   758.3   7,131.4   897.7   997.2   792.8   197.9   2,009.2


                Additional   increase   (decrease) in   speed      25.87       25.91   22.62   26.03   52.36   42.74   -48.39   -5.94   -16.29   31.72   61.18   -3.44   20.38   23.16   18.43


                     2013   28,694.6      9,813.4   1,335.6   5 112.4   422.8   1,522.8   16.0   19.0   429.1   5,945.9   714.5   879.7   759.7   167.0   1,556.7


                     year 2012   22,797.3      7,794.0   1,089.2   4,056.5   277.5   1,066.8   31.0   20.2   512.6   4,514.0   443.3   911.0   631.1   135.6   1,314.5


                 Capital investments in economic sectors, billion rubles. sum   153
                Additional growth   (decrease) rate, T      17.05       30.27   77.50   -20.55   44.70   8.18   95.11   -16.25   24.09   44.27   -0.55   28.86   -1.00   25.14   44.92


                     2011   17,953.4      6,070.3   942.5   3,624.8   317.9   804.4   35.9   23.7   462.1   3,342.5   291.1   442.9   404.2   178.7   1,012.4  Source: Compiled based on information from the Ministry of Economy of the Republic of Uzbekistan.


                     2010   15,338.7      4 659.9   531.0   4,562.5   219.7   743.6   18.4   28.3   372.4   2,316.8   292.7   343.7   408.3   142.8   698.6_ _


                           Capital investments - general   Agriculture and forestry   Transport and communications   Trade and catering   Semi-finished products   Information service   Housing construction   Municipal construction   Health care institutions   Educational institutions _   Cultural and art institutions
                     Indicators


                                         Construction
                                                                        Other areas
                                 Production
                              Including:
                                                    Geology