
Page 77 - J0JAPS_VOL14
P. 77
Widodo Puji / JOJAPS – JOURNAL ONLINE JARINGAN PENGAJIAN SENI BINA
In this research, we will conduct experiment to know the influence of cooling temperature to the dimension of plastic
injection process. We conduct the direct survey at Sanpak Unggul Industrie. Shrinkage is one of the constraints that causes the
high number of product defect, so that, the experiments are performed by varying the cooling temperature of the production
process. From each variation of the temperature, we obtain the product 5 results that will be verified the real products dimension
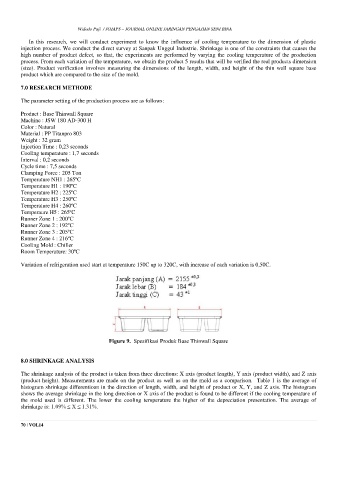
(size). Product verification involves measuring the dimensions of the length, width, and height of the thin wall square base
product which are compared to the size of the mold.
7.0 RESEARCH METHODE
The parameter setting of the production process are as follows:
Product : Base Thinwall Square
Machine : JSW 180 AD-300 H
Color : Natural
Material : PP Titanpro 803
Weight : 32 gram
Injection Time : 0,23 seconds
Cooling temperature : 1,7 seconds
Interval : 0,2 seconds
Cycle time : 7,5 seconds
Clamping Force : 205 Ton
Temperature NH1 : 265ºC
Temperature H1 : 190ºC
Temperature H2 : 225ºC
Temperature H3 : 250ºC
Temperature H4 : 260ºC
Temperaure H5 : 265ºC
Runner Zone 1 : 200ºC
Runner Zone 2 : 192ºC
Runner Zone 3 : 205ºC
Runner Zone 4 : 216ºC
Cooling Mold : Chiller
Room Temperature: 30ºC
Variation of refrigeration used start at temperature 150C up to 320C, with increase of each variation is 0,50C.
Figure 9. Spesifikasi Produk Base Thinwall Square
8.0 SHRINKAGE ANALYSIS
The shrinkage analysis of the product is taken from three directions: X axis (product length), Y axis (product width), and Z axis
(product height). Measurements are made on the product as well as on the mold as a comparison. Table 1 is the average of
histogram shrinkage differentioan in the direction of length, width, and height of product or X, Y, and Z axis. The histogram
shows the average shrinkage in the long direction or X axis of the product is found to be different if the cooling temperature of
the mold used is different. The lower the cooling temperature the higher of the depreciation presentation. The average of
shrinkage is: 1.09% ≤ X ≤ 1.31%.
70 | VOL14