
Page 18 - JOJAPS_VOL15
P. 18
Cahyo Wibowo / JOJAPS – JOURNAL ONLINE JARINGAN PENGAJIAN SENI BINA
In calculating the mass flow rate or flow-rate using a calculation assuming the orifice meter or commonly called the differential
pressure flow calculation. The comparison of measurements with orifice and the results of measurements with flow-meters is
shown in Figure 19.
Figure 17. Comparison of measurements with orifice and measurement results with flow-meters.
Resumes from the results of the discussion above know that based on the regression results the regression equation is obtained as
follows: Regression Equation Effect of Pressure (X1) on Temperature (X2): X1 = 113 - 3.20 X2. Effect of Pressure Regression
(X1) on Mass Flow Rate (Y): Y1 = 82.6 + 0.112 X1. Effect of Temperature Regression (X2) on Mass Flow Rate (Y): Y = 104 -
0.0842 X2. Effect of Regression on the Effect of Pressure (X1) on Temperature (X2) on Mass Flow Rate (Y): Y = 113 - 0.322 X2
- 0.074 X1. Effect of Temperature on JTE: X2 = - 16.1 + 11 X3. Effect of Pressure on JTE: X1 = 159 + 33 X3. Effect of Pressure,
Temperature and Flow Rate on JTE X3 = 0.49 + 0.00341 X1 + 0.0105 X2 - 0.0076 Y. Individually, the pressure affects
temperature, this proves that the higher the CNG pressure then when it flows it will produce a low temperature to a certain pressure
limit the temperature will rise. Pressure has an effect on flow-rate, this is proven that at a pressure of 250bar the flow-rate will flow
more than linearly when the pressure decreases, the flow-rate will decrease further. Together the pressure and temperature have an
effect on the flow-rate, but the temperature has no significant effect on the flow-rate. And together pressure, temperature and flow-
rate affect the JTE, the higher the pressure, the higher the JTE, the lower the temperature will affect the JTE, the thicker the icing,
the greater the flow rate, the faster the JTE will occur. To reinforce the results of the study, it is compared graphically between the
JTE graph theory and the JTE graph of the results of the research shown in Figure 20 and Figure 21.
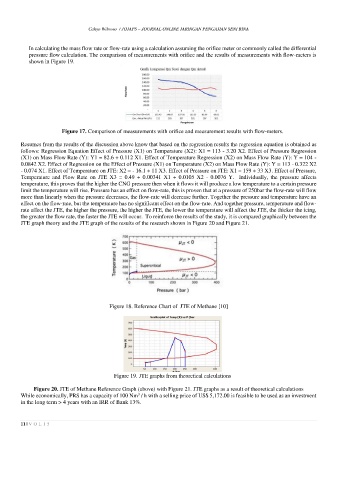
Figure 18. Reference Chart of JTE of Methane [10]
Figure 19. JTE graphs from theoretical calculations
Figure 20. JTE of Methane Reference Graph (above) with Figure 21. JTE graphs as a result of theoretical calculations
3
While economically, PRS has a capacity of 100 Nm / h with a selling price of US$ 5,172.00 is feasible to be used as an investment
in the long term > 4 years with an IRR of Bank 13%.
11 | V O L 1 5