
Page 17 - JOJAPS_VOL15
P. 17
Cahyo Wibowo / JOJAPS – JOURNAL ONLINE JARINGAN PENGAJIAN SENI BINA
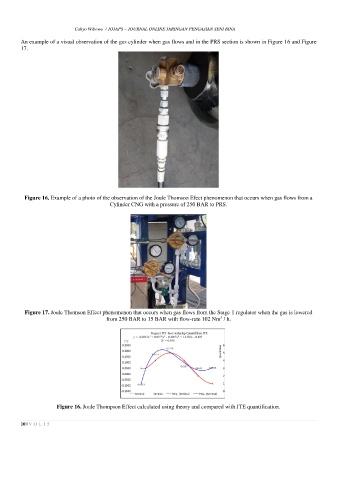
An example of a visual observation of the gas cylinder when gas flows and in the PRS section is shown in Figure 16 and Figure
17.
Figure 16. Example of a photo of the observation of the Joule Thomson Efect phenomenon that occurs when gas flows from a
Cylinder CNG with a pressure of 250 BAR to PRS.
Figure 17. Joule Thomson Effect phenomenon that occurs when gas flows from the Stage 1 regulator when the gas is lowered
3
from 250 BAR to 15 BAR with flow-rate 102 Nm / h.
Figure 16. Joule Thompson Effect calculated using theory and compared with JTE quantification.
10 | V O L 1 5