
Page 14 - JOJAPS_VOL15
P. 14
Cahyo Wibowo / JOJAPS – JOURNAL ONLINE JARINGAN PENGAJIAN SENI BINA
The variables to be examined from this study are shown in Figure 12.
Pressure (P 1)
X 1
Joule
Flow-rate Thompson
(Q m)
Effect JTE 1)
Y 1
Z 1
Temperature
(T 2)
X 2
Figure 12. Path diagram of parameter analysis.
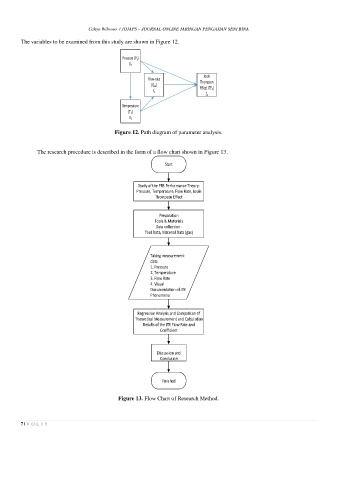
The research procedure is described in the form of a flow chart shown in Figure 13.
Start
Study of the PRS Performance Theory;
Pressure, Temperature, Flow Rate, Joule
Thompson Effect
Preparation
Tools & Materials
Data collection :
Tool Data, Material Data (gas)
Taking measurement
data
1. Pressure
2. Temperature
3. Flow Rate
4. Visual
Documentation of JTE
Phenomena
Regression Analysis and Comparison of
Theoretical Measurement and Calculation
Results of the JTE Flow Rate and
Coefficient
Discussion and
Conclusion
Finished
Figure 13. Flow Chart of Research Method.
7 | V O L 1 5