
Page 15 - JOJAPS_VOL15
P. 15
Cahyo Wibowo / JOJAPS – JOURNAL ONLINE JARINGAN PENGAJIAN SENI BINA
RESULTS AND DISCUSSION
The results of measurements of P, T, first Qm on PRS are shown in Table 2.
Table 2 Results of measurement of P, T & Qm.
P1 T2 T1 P2 P3 T3 Q m-Actual
Time [min]
BAR o C o C BAR BAR o C Nm3/h
1 250 -45 11.00 15 1 26 111
2 230 -39 32.00 15 0.9 28 105
3 200 -20 33.00 15 0.9 33 107
4 183 -17 33.00 15 0.7 33 104
5 162 -12 33.00 14 0.7 34 101
6 138 -7 31.00 13.5 0.6 33 98
7 114 -3 32.00 12 0.6 34 89
8 102 -0.2 33.00 11 0.5 37 86
9 77 6 32.00 10 0.5 37 107
10 53 19 35.00 8 0.4 35 102
11 31 26 37.00 5 0.2 38 86
12 20 28 38.00 4 0.2 40 70
Figure 14. Graph of pressure drop followed by changes in temperature until changes in temperature at a certain point from
negative to positive.
3
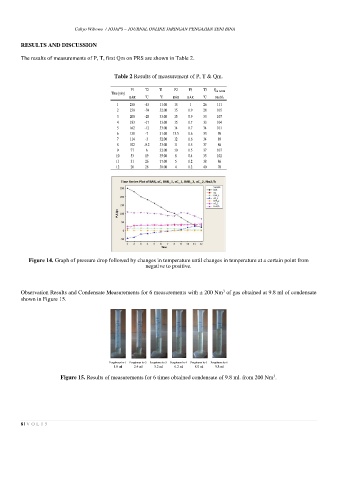
Observation Results and Condensate Measurements for 6 measurements with ± 200 Nm of gas obtained at 9.8 ml of condensate
shown in Figure 15.
Pengukuran ke-1 Pengukuran ke-2 Pengukuran ke-3 Pengukuran ke-4 Pengukuran ke-5 Pengukuran ke-6
1.8 ml 2.4 ml 5.2 ml 6.2 ml 8.0 ml 9.8 ml
3
Figure 15. Results of measurements for 6 times obtained condensate of 9.8 ml. from 200 Nm .
8 | V O L 1 5