Page 16 - JOJAPS_VOL15
P. 16

Cahyo Wibowo  / JOJAPS – JOURNAL ONLINE JARINGAN PENGAJIAN SENI BINA
        JTE Calculation at 250 bar pressure [7]


                                       [   ̂ −    (      ̂ ) ]
                                ) ]
                      [   −    (                  
           = (  ) = −              = −               =
                                               ̂   
                   ̂
           ̂ = (  )


        Heat Capacity Calculation    ̂  :
                                 

                   ̂     ̂ (39.47℃) −    ̂(−45℃)
           ̂ = (      ) =
           
                        (39.47 − (−19))℃

                                       
          (−140.2893 − (−175.5794)        35.2901            
        =                             =        = 0.6035
                    58.47               58.47               .   

                                                             3
              ̂     ̂ (39.47℃) −    ̂ (−45℃)  (0.00611 − 0.07366)        −0.0675            3
        (   ) ≈                       =                       =         = −7.975  × 10 −4
                   (39.47 − (−45))℃            84.47             84.7                       .   
               

                                  ̂
                      [   ̂ −    (  ) ]
                                 
           = (  ) = −              
                              ̂   


                            3
                             .   
           = −0.090108614
                               

                     -3
                             3
        Since  1 kJ = 10  MPa.m , and 1 MPa = 10 bar [9]

                                                                                     o
        Then the Joule Coefficient of Thompshon Effect Natural Gas at a pressure of 250 bar and 39.47 C  is :
                                                             K              K
                                          μ = −0.090108614      = −0.9x10 −2
                                                            MPa            bar
                              K           o
        On value −0.009010861    or -273.159  C/Bar,  Icing happened.
                             bar

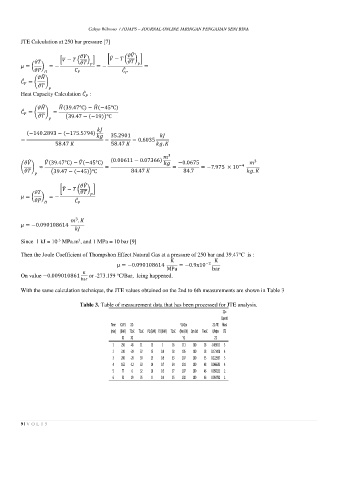
        With the same calculation technique, the JTE values obtained on the 2nd to 6th measurements are shown in Table 3

                             Table 3. Table of measurement data that has been processed for JTE analysis.
                                                                               Z2=
                                                                               Quanti
                                        Time  X1-P1  X2-        Y1-Qm       Z1-JTE  fikasi
                                        [min] (BAR) T2oC T1oC P2 (BAR) P3 (BAR) T2oC (Nm3/h) Qm Std TwoC K/Mpa JTE
                                            X1  X2               Y1         Z1
                                         1  250  -45  11  15  1  26  111  100  28  -0.09011 3
                                         2  230  -39  32  15  0.9  28  105  100  28  0.171428 4
                                         3  200  -20  33  15  0.9  33  107  100  55  0.222937 5
                                         4  162  -12  33  14  0.7  34  101  100  48  0.066683 4
                                         5  77  6  32  10  0.5  37  107  100  46  0.050233 2
                                         6  53  19  35  8  0.4  35  102  100  46  0.054792 1


        9 | V O L 1 5
   11   12   13   14   15   16   17   18   19   20   21