
Page 638 - Krugmans Economics for AP Text Book_Neat
P. 638
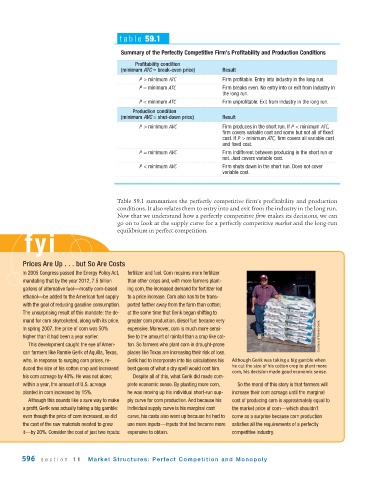
table 59.1

                                         Summary of the Perfectly Competitive Firm’s Profitability and Production Conditions

                                             Profitability condition
                                         (minimum ATC = break - even price)  Result
                                               P > minimum ATC            Firm profitable. Entry into industry in the  long run.
                                               P = minimum ATC            Firm breaks even. No entry into or exit from industry in
                                                                          the  long run.
                                               P < minimum ATC            Firm unprofitable. Exit from industry in the  long run.
                                            Production condition
                                         (minimum AVC = shut - down price)  Result
                                               P > minimum AVC            Firm produces in the short run. If P < minimum ATC,
                                                                          firm covers variable cost and some but not all of fixed
                                                                          cost. If P > minimum ATC, firm covers all variable cost
                                                                          and fixed cost.
                                               P = minimum AVC            Firm indifferent between producing in the short run or
                                                                          not. Just covers variable cost.
                                               P < minimum AVC            Firm shuts down in the short run. Does not cover
                                                                          variable cost.


                                       Table 59.1 summarizes the perfectly competitive firm’s profitability and production
                                       conditions. It also relates them to entry into and exit from the industry in the long run.
                                       Now that we understand how a perfectly competitive firm makes its decisions, we can
                                       go on to look at the supply curve for a perfectly competitive market and the long-run
                                       equilibrium in perfect competition.
         fyi


         Prices Are Up . . . but So Are Costs
         In 2005 Congress passed the Energy Policy Act,  fertilizer and fuel. Corn requires more fertilizer
         mandating that by the year 2012, 7.5 billion  than other crops and, with more farmers plant-
         gallons of alternative fuel—mostly corn-based  ing corn, the increased demand for fertilizer led
         ethanol—be added to the American fuel supply  to a price increase. Corn also has to be trans-
         with the goal of reducing gasoline consumption.  ported farther away from the farm than cotton;
         The unsurprising result of this mandate: the de-  at the same time that Gerik began shifting to
         mand for corn skyrocketed, along with its price.  greater corn production, diesel fuel became very
         In spring 2007, the price of corn was 50%  expensive. Moreover, corn is much more sensi-
         higher than it had been a year earlier.  tive to the amount of rainfall than a crop like cot-    Courtesy of Ronnie Gerik.
          This development caught the eye of Ameri-  ton. So farmers who plant corn in drought-prone
         can farmers like Ronnie Gerik of Aquilla, Texas,  places like Texas are increasing their risk of loss.
         who, in response to surging corn prices, re-  Gerik had to incorporate into his calculations his  Although Gerik was taking a big gamble when
                                                                             he cut the size of his cotton crop to plant more
         duced the size of his cotton crop and increased  best guess of what a dry spell would cost him.
                                                                             corn, his decision made good economic sense.
         his corn acreage by 40%. He was not alone;  Despite all of this, what Gerik did made com-
         within a year, the amount of U.S. acreage  plete economic sense. By planting more corn,  So the moral of this story is that farmers will
         planted in corn increased by 15%.  he was moving up his individual short-run sup-  increase their corn acreage until the marginal
          Although this sounds like a sure way to make  ply curve for corn production. And because his  cost of producing corn is approximately equal to
         a profit, Gerik was actually taking a big gamble:  individual supply curve is his marginal cost  the market price of corn—which shouldn’t
         even though the price of corn increased, so did  curve, his costs also went up because he had to  come as a surprise because corn production
         the cost of the raw materials needed to grow  use more inputs—inputs that had become more  satisfies all the requirements of a perfectly
         it—by 20%. Consider the cost of just two inputs:  expensive to obtain.  competitive industry.


        596   section 11      Market Structures: Perfect  Competition  and Monopoly