Page 640 - Krugmans Economics for AP Text Book_Neat
P. 640

Tackle the Test: Free-Response Questions
        Draw a correctly labeled graph showing a perfectly competitive  2. Refer to the graph provided.
        firm producing and incurring a loss in the short run.
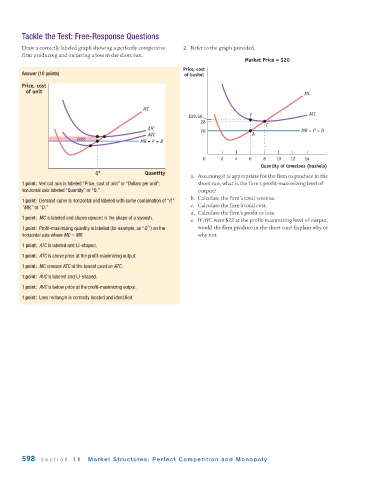
                                                                                 Market Price = $20
                                                             Price, cost
        Answer (10 points)                                   of bushel
        Price, cost
          of unit                                                                                    MC


                                                MC
                                                               $29.50              Y                  ATC
                                                                   28
                                                                                        C
                                                 ATC               20                               MR = P = D
                                                 AVC                               A
                          Loss
                                               MR = P = D

                                                                   0     2    4    6   8   10   12   14
                                                                                      Quantity of tomatoes (bushels)
                                Q*              Quantity
                                                               a. Assuming it is appropriate for the firm to produce in the
        1 point: Vertical axis is labeled “Price, cost of unit” or “Dollars per unit”;  short run, what is the firm’s profit-maximizing level of
        horizontal axis labeled “Quantity” or “Q.”                output?
                                                               b. Calculate the firm’s total revenue.
        1 point: Demand curve is horizontal and labeled with some combination of “P,”
        “MR,” or “D.”                                          c. Calculate the firm’s total cost.
                                                               d. Calculate the firm’s profit or loss.
        1 point: MC is labeled and slopes upward in the shape of a swoosh.
                                                               e. If AVC were $22 at the profit-maximizing level of output,
                                                 *
        1 point: Profit-maximizing quantity is labeled (for example, as “Q ”) on the  would the firm produce in the short run? Explain why or
        horizontal axis where MC = MR.                            why not.
        1 point: ATC is labeled and U-shaped.
        1 point: ATC is above price at the profit-maximizing output.
        1 point: MC crosses ATC at the lowest point on ATC.
        1 point: AVC is labeled and U-shaped.
        1 point: AVC is below price at the profit-maximizing output.
        1 point: Loss rectangle is correctly located and identified.


        598   section   11    Market Structures: Perfect  Competition  and Monopoly
   635   636   637   638   639   640   641   642   643   644   645