
Page 656 - Krugmans Economics for AP Text Book_Neat
P. 656
fyi
Monopoly Behavior and the Price Elasticity of Demand
A monopolist faces marginal revenue that is less than 1, this will actually reduce revenue—
lower than the market price. But how much that is, marginal revenue will be negative. The mo-
lower? The answer depends on the price elas- nopolist can increase revenue by producing more
ticity of demand. only if the price elasticity of demand is greater
Remember that the price elasticity of de- than 1; the higher the elasticity, the closer the ad-
mand determines how total revenue from sales ditional revenue is to the initial market price.
changes when the price changes. If the price What this tells us is that the difference be- KAREN BLEIER/AFP/Getty Images
elasticity is greater than 1 (demand is elastic), a tween monopoly behavior and perfectly com-
fall in the price increases total revenue because petitive behavior depends on the price elasticity
the rise in the quantity demanded outweighs the of demand. A monopolist that faces highly elas-
lower price of each unit sold. If the price elastic- tic demand will behave almost like a firm in a
ity is less than 1 (demand is inelastic), a lower perfectly competitive industry. planes. In contrast, a monopolist that faces
price reduces total revenue. For example, Amtrak has a monopoly on in- less elastic demand—like most cable TV
When a monopolist increases output by one tercity passenger service in the Northeast Corri- companies—will behave very differently from a
unit, it must reduce the market price in order to dor, but it has very little ability to raise prices: perfect competitor: it will charge much higher
sell that unit. If the price elasticity of demand is potential train travelers will switch to cars and prices and restrict output more.
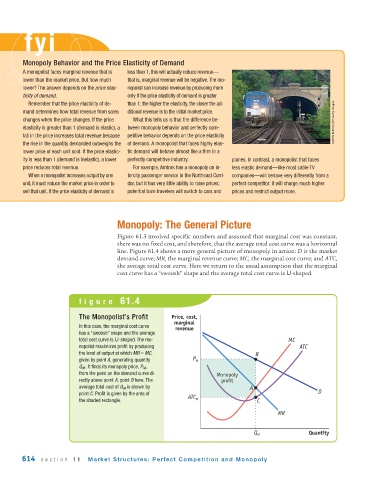
Monopoly: The General Picture
Figure 61.3 involved specific numbers and assumed that marginal cost was constant,
there was no fixed cost, and therefore, that the average total cost curve was a horizontal
line. Figure 61.4 shows a more general picture of monopoly in action: D is the market
demand curve; MR, the marginal revenue curve; MC, the marginal cost curve; and ATC,
the average total cost curve. Here we return to the usual assumption that the marginal
cost curve has a “swoosh” shape and the average total cost curve is U-shaped.
figure 61.4
The Monopolist’s Profit Price, cost,
marginal
In this case, the marginal cost curve
revenue
has a “swoosh” shape and the average
total cost curve is U-shaped. The mo- MC
nopolist maximizes profit by producing ATC
the level of output at which MR = MC, B
given by point A, generating quantity P M
Q M . It finds its monopoly price, P M ,
from the point on the demand curve di- Monopoly
rectly above point A, point B here. The profit
average total cost of Q M is shown by A
point C. Profit is given by the area of D
the shaded rectangle. ATC M C
MR
Q M Quantity
614 section 11 Market Structures: Perfect Competition and Monopoly