
Page 653 - Krugmans Economics for AP Text Book_Neat
P. 653
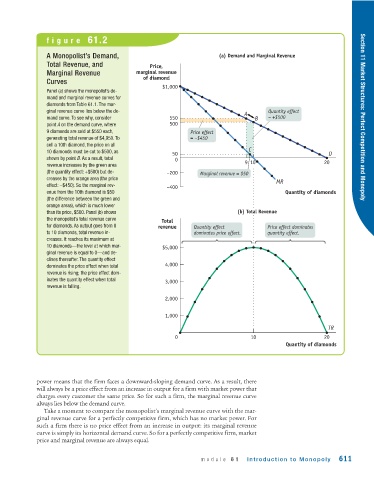
figure  61.2


                A Monopolist’s Demand,                                   (a) Demand and Marginal Revenue
                Total Revenue, and                Price,
                Marginal Revenue              marginal revenue
                                                of diamond
                Curves
                                                      $1,000
                Panel (a) shows the monopolist’s de-
                mand and marginal revenue curves for
                diamonds from Table 61.1. The mar-
                ginal revenue curve lies below the de-                           A       Quantity effect
                mand curve. To see why, consider        550                         B    = +$500                       Section 11 Market Structures: Perfect Competition and Monopoly
                point A on the demand curve, where      500
                9 diamonds are sold at $550 each,              Price effect
                generating total revenue of $4,950. To         = –$450
                sell a 10th diamond, the price on all
                                                                                  C
                10 diamonds must be cut to $500, as      50                                                  D
                shown by point B. As a result, total      0                      910
                revenue increases by the green area                                                        20
                (the quantity effect: +$500) but de-    –200       Marginal revenue = $50
                creases by the orange area (the price
                                                                                           MR
                effect: −$450). So the marginal rev-    –400
                enue from the 10th diamond is $50                                             Quantity of diamonds
                (the difference between the green and
                orange areas), which is much lower
                than its price, $500. Panel (b) shows                          (b) Total Revenue
                the monopolist’s total revenue curve
                                                      Total
                for diamonds. As output goes from 0   revenue   Quantity effect          Price effect dominates
                to 10 diamonds, total revenue in-               dominates price effect.  quantity effect.
                creases. It reaches its maximum at
                10 diamonds—the level at which mar-   $5,000
                ginal revenue is equal to 0—and de-
                clines thereafter. The quantity effect
                dominates the price effect when total  4,000
                revenue is rising; the price effect dom-
                inates the quantity effect when total  3,000
                revenue is falling.
                                                       2,000


                                                       1,000
                                                                                                            TR
                                                          0                        10                      20
                                                                                               Quantity of diamonds


             power means that the firm faces a downward-sloping demand curve. As a result, there
             will always be a price effect from an increase in output for a firm with market power that
             charges every customer the same price. So for such a firm, the marginal revenue curve
             always lies below the demand curve.
               Take a moment to compare the monopolist’s marginal revenue curve with the mar-
             ginal revenue curve for a perfectly competitive firm, which has no market power. For
             such a firm there is no price effect from an increase in output: its marginal revenue
             curve is simply its horizontal demand curve. So for a perfectly competitive firm, market
             price and marginal revenue are always equal.


                                                                   module  61     Introduction to Monopoly      611