
Page 652 - Krugmans Economics for AP Text Book_Neat
P. 652
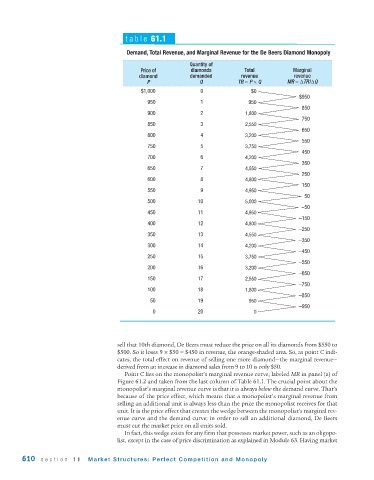
table 61.1

                                          Demand, Total Revenue, and Marginal Revenue for the De Beers Diamond Monopoly

                                                               Quantity of
                                               Price of        diamonds          Total           Marginal
                                               diamond         demanded         revenue          revenue
                                                 P                Q            TR = P × Q      MR =ΔTR/ΔQ
                                               $1,000              0               $0
                                                                                                   $950
                                                 950               1              950
                                                                                                    850
                                                 900               2             1,800
                                                                                                    750
                                                 850               3             2,550
                                                                                                    650
                                                 800               4             3,200
                                                                                                    550
                                                 750               5             3,750
                                                                                                    450
                                                 700               6             4,200
                                                                                                    350
                                                 650               7             4,550
                                                                                                    250
                                                 600               8             4,800
                                                                                                    150
                                                 550               9             4,950
                                                                                                     50
                                                 500              10             5,000
                                                                                                    −50
                                                 450              11             4,950
                                                                                                   −150
                                                 400              12             4,800
                                                                                                   −250
                                                 350              13             4,550
                                                                                                   −350
                                                 300              14             4,200
                                                                                                   −450
                                                 250              15             3,750
                                                                                                   −550
                                                 200              16             3,200
                                                                                                   −650
                                                 150              17             2,550
                                                                                                   −750
                                                 100              18             1,800
                                                                                                   −850
                                                  50              19              950
                                                                                                   −950
                                                   0              20                0


                                       sell that 10th diamond, De Beers must reduce the price on all its diamonds from $550 to
                                       $500. So it loses 9 × $50 = $450 in revenue, the orange-shaded area. So, as point C indi-
                                       cates, the total effect on revenue of selling one more diamond—the marginal revenue—
                                       derived from an increase in diamond sales from 9 to 10 is only $50.
                                          Point C lies on the monopolist’s marginal revenue curve, labeled MR in panel (a) of
                                       Figure 61.2 and taken from the last column of Table 61.1. The crucial point about the
                                       monopolist’s marginal revenue curve is that it is always below the demand curve. That’s
                                       because of the price effect, which means that a monopolist’s marginal revenue from
                                       selling an additional unit is always less than the price the monopolist receives for that
                                       unit. It is the price effect that creates the wedge between the monopolist’s marginal rev-
                                       enue curve and the demand curve: in order to sell an additional diamond, De Beers
                                       must cut the market price on all units sold.
                                          In fact, this wedge exists for any firm that possesses market power, such as an oligopo-
                                       list, except in the case of price discrimination as explained in Module 63. Having market

        610   section 11      Market Structures: Perfect Competition and Monopoly