
Page 654 - Krugmans Economics for AP Text Book_Neat
P. 654
To emphasize how the quantity and price effects offset each other
for a firm with market power, De Beers’s total revenue curve is shown
in panel (b) of Figure 61.2. Notice that it is hill-shaped: as output
rises from 0 to 10 diamonds, total revenue increases. This reflects the
fact that at low levels of output, the quantity effect is stronger than the price
effect: as the monopolist sells more, it has to lower the price on only
very few units, so the price effect is small. As output rises beyond 10
diamonds, total revenue actually falls. This reflects the fact that at
high levels of output, the price effect is stronger than the quantity effect: as the
monopolist sells more, it now has to lower the price on many units of
output, making the price effect very large. Correspondingly, the mar-
ginal revenue curve lies below zero at output levels above 10 dia-
monds. For example, an increase in diamond production from 11 to
12 yields only $400 for the 12th diamond, simultaneously reducing
the revenue from diamonds 1 through 11 by $550. As a result, the
Corbis marginal revenue of the 12th diamond is −$150.
The Monopolist’s Profit-Maximizing
Output and Price
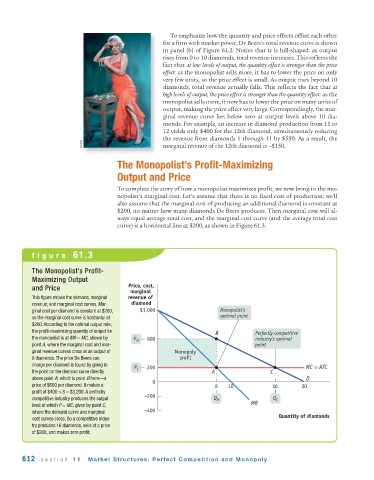
To complete the story of how a monopolist maximizes profit, we now bring in the mo-
nopolist’s marginal cost. Let’s assume that there is no fixed cost of production; we’ll
also assume that the marginal cost of producing an additional diamond is constant at
$200, no matter how many diamonds De Beers produces. Then marginal cost will al-
ways equal average total cost, and the marginal cost curve (and the average total cost
curve) is a horizontal line at $200, as shown in Figure 61.3.
figure 61.3
The Monopolist’s Profit-
Maximizing Output
and Price Price, cost,
marginal
This figure shows the demand, marginal revenue of
revenue, and marginal cost curves. Mar- diamond
ginal cost per diamond is constant at $200, $1,000 Monopolist’s
so the marginal cost curve is horizontal at optimal point
$200. According to the optimal output rule,
the profit-maximizing quantity of output for B Perfectly competitive
the monopolist is at MR = MC, shown by P M 600 industry’s optimal
point A, where the marginal cost and mar- point
ginal revenue curves cross at an output of Monopoly
8 diamonds. The price De Beers can profit
charge per diamond is found by going to
P C 200 MC = ATC
the point on the demand curve directly A C
above point A, which is point B here—a 0 D
price of $600 per diamond. It makes a 8 10 16 20
profit of $400 × 8 = $3,200. A perfectly
competitive industry produces the output –200 Q M Q C
level at which P = MC, given by point C, MR
where the demand curve and marginal –400
Quantity of diamonds
cost curves cross. So a competitive indus-
try produces 16 diamonds, sells at a price
of $200, and makes zero profit.
612 section 11 Market Structures: Perfect Competition and Monopoly