
Page 704 - Krugmans Economics for AP Text Book_Neat
P. 704
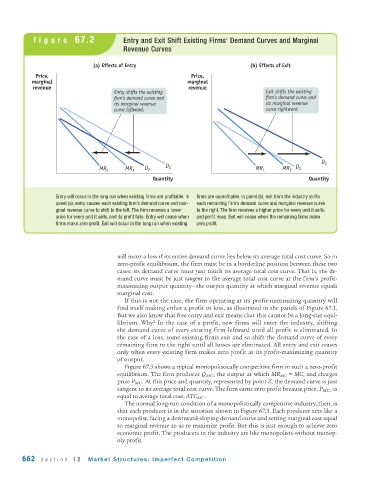
figure  67.2                 Entry and Exit Shift Existing Firms’ Demand Curves and Marginal
                                         Revenue Curves


                               (a) Effects of Entry                                (b) Effects of Exit
             Price,                                             Price,
           marginal                                           marginal
            revenue                                            revenue
                                      Entry shifts the existing                         Exit shifts the existing
                                      firm’s demand curve and                            firm’s demand curve and
                                      its marginal revenue                              its marginal revenue
                                      curve leftward.                                   curve rightward.


                                                                                                          D 2
                                  MR 2    MR 1  D 2    D 1                           MR 1    MR 2  D 1
                                                   Quantity                                           Quantity


                   Entry will occur in the long run when existing firms are profitable. In  firms are unprofitable. In panel (b), exit from the industry shifts
                   panel (a), entry causes each existing firm’s demand curve and mar-  each remaining firm’s demand curve and marginal revenue curve
                   ginal revenue curve to shift to the left. The firm receives a lower  to the right. The firm receives a higher price for every unit it sells,
                   price for every unit it sells, and its profit falls. Entry will cease when  and profit rises. Exit will cease when the remaining firms make
                   firms make zero profit. Exit will occur in the long run when existing  zero profit.


                                       will incur a loss if its entire demand curve lies below its average total cost curve. So in
                                       zero-profit equilibrium, the firm must be in a borderline position between these two
                                       cases; its demand curve must just touch its average total cost curve. That is, the de-
                                       mand curve must be just tangent to the average total cost curve at the firm’s profit-
                                       maximizing output quantity—the output quantity at which marginal revenue equals
                                       marginal cost.
                                          If this is not the case, the firm operating at its profit-maximizing quantity will
                                       find itself making either a profit or loss, as illustrated in the panels of Figure 67.1.
                                       But we also know that free entry and exit means that this cannot be a long-run equi-
                                       librium. Why? In the case of a profit, new firms will enter the industry, shifting
                                       the demand curve of every existing firm leftward until all profit is eliminated. In
                                       the case of a loss, some existing firms exit and so shift the demand curve of every
                                       remaining firm to the right until all losses are eliminated. All entry and exit ceases
                                       only when every existing firm makes zero profit at its profit-maximizing quantity
                                       of output.
                                          Figure 67.3 shows a typical monopolistically competitive firm in such a zero-profit
                                       equilibrium. The firm produces Q MC , the output at which MR MC = MC, and charges
                                       price P MC . At this price and quantity, represented by point Z, the demand curve is just
                                       tangent to its average total cost curve. The firm earns zero profit because price, P MC , is
                                       equal to average total cost, ATC MC .
                                          The normal long-run condition of a monopolistically competitive industry, then, is
                                       that each producer is in the situation shown in Figure 67.3. Each producer acts like a
                                       monopolist, facing a downward-sloping demand curve and setting marginal cost equal
                                       to marginal revenue so as to maximize profit. But this is just enough to achieve zero
                                       economic profit. The producers in the industry are like monopolists without monop-
                                       oly profit.

        662   section  12     Market Structures: Imperfect Competition