
Page 458 - NGTU_paper_withoutVideo
P. 458
Modern Geomatics Technologies and Applications
1
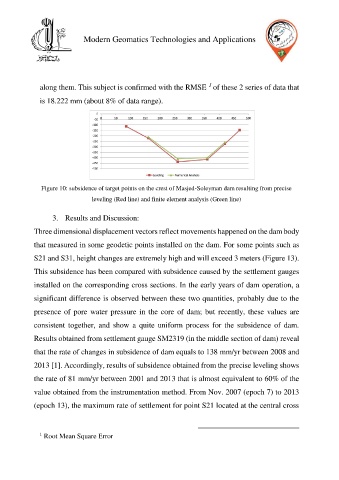
along them. This subject is confirmed with the RMSE of these 2 series of data that
is 18.222 mm (about 8% of data range).
Figure 10: subsidence of target points on the crest of Masjed-Soleyman dam resulting from precise
leveling (Red line) and finite element analysis (Green line)
3. Results and Discussion:
Three dimensional displacement vectors reflect movements happened on the dam body
that measured in some geodetic points installed on the dam. For some points such as
S21 and S31, height changes are extremely high and will exceed 3 meters (Figure 13).
This subsidence has been compared with subsidence caused by the settlement gauges
installed on the corresponding cross sections. In the early years of dam operation, a
significant difference is observed between these two quantities, probably due to the
presence of pore water pressure in the core of dam; but recently, these values are
consistent together, and show a quite uniform process for the subsidence of dam.
Results obtained from settlement gauge SM2319 (in the middle section of dam) reveal
that the rate of changes in subsidence of dam equals to 138 mm/yr between 2008 and
2013 [1]. Accordingly, results of subsidence obtained from the precise leveling shows
the rate of 81 mm/yr between 2001 and 2013 that is almost equivalent to 60% of the
value obtained from the instrumentation method. From Nov. 2007 (epoch 7) to 2013
(epoch 13), the maximum rate of settlement for point S21 located at the central cross
1 Root Mean Square Error