Page 604 - NGTU_paper_withoutVideo
P. 604
Modern Geomatics Technologies and Applications

          respectively. Mansouri and Kargar [8] made an analysis of 10000 accidents during 2011 to 2013 in Isfahan province, Iran with
          CART, C5.0, CHAID and Quest trees. They found that out of the mentioned methods, C5.0 tree outperformed the other decision
          trees with an accuracy rate of 70.18%, while CART had the worst prediction on test data with an accuracy of 43.98%. Delen et
          al. [9] used a survey to model the relationships between various levels of injury severity and crash factors. They applied numerous
          experimentations with four top prediction models including Neural Networks (NN), Support Vector Machines (SVM), C5.0 tree
          and Logistic regression (LR) on a nationwide data collection. According to the results, SVM was the most accurate classifier
          with an accuracy rate of 90.41% followed by C5.0 tree with an accuracy of 86.61%. In the final part of their research, the
          sensitivity analysis results revealed that factors like wearing sea belt, manner of collision, ejection from the car and drug use
          were the most important variable affecting accidents occurrence.
                In order to study the behaviour of accidents, Diaz et al. [10] trained C5.0 and recursive partitioning (PART) for Spanish
          accident database from 2008 to 2013, separately. The study concluded that C5.0 outperformed PART in each year in terms of
          accuracy. Kumar and Ramamurthy [11] analysed 2013 road accidents in United Kingdom to build a prediction model with
          Artificial Neural Network (ANN) and C5.0 tree. The findings demonstrated that C5.0 performed with an accuracy of 79.8%,
          which was pretty similar for ANN with less than 0.8%. Yuan et al [12] established C5.0, CHAID and CART decision trees to
          identify high-influence factors on the severity of side right-angle collision accidents. Apart from C5.0 better performance with
          an accuracy of 61.9%, drunk driving was found to be the most important factor followed by weather conditions and over speeding.

          3.  Data Description
               Fatality Analysis Reporting System (FARS) collects data for analysis of crashes to identify and evaluate actions leading
          to reduce deaths, injuries and property damage resulting from motor vehicle crashes. The FARS dataset for this study covers
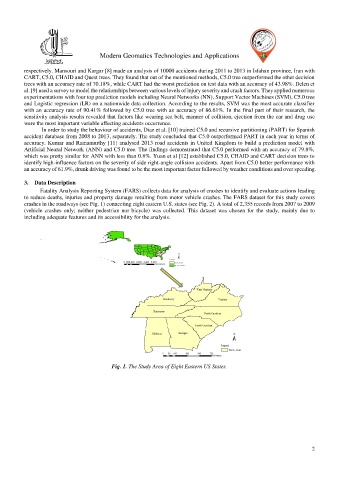
          crashes in the roadways (see Fig. 1) connecting eight eastern U.S. states (see Fig. 2). A total of 2,355 records from 2007 to 2009
          (vehicle  crashes  only;  neither  pedestrian  nor  bicycle)  was  collected. This  dataset  was  chosen  for  the  study,  mainly  due  to
          including adequate features and its accessibility for the analysis.


               .


                                        Fig. 1. The Study Area of Eight Eastern US States.


                                                                                                               2

