Page 608 - NGTU_paper_withoutVideo
P. 608

Modern Geomatics Technologies and Applications


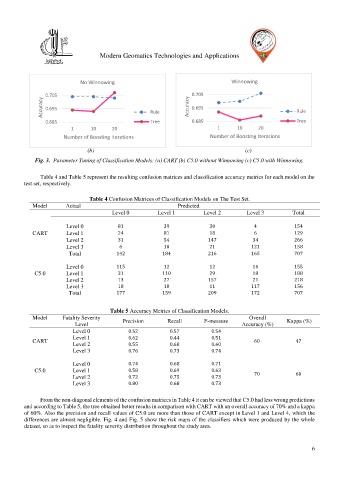
                             No Winnowing                                         Winnowing

                  0.705                                             0.705
                Accuracy       0.695                  Rule         Accuracy  0.695                       Rule


                  0.685                               Tree          0.685                                Tree
                          1      10     20                                   1      10      20
                       Number of Boosting Iterations                       Number of Boosting Iterations

                                (b)                                                                                                          (c)
             Fig. 3.  Parameter Tuning of Classification Models: (a) CART (b) C5.0 without Winnowing (c) C5.0 with Winnowing.


               Table 4 and Table 5 represent the resulting confusion matrices and classification accuracy metrics for each model on the
          test set, respectively.

                                Table 4 Confusion Matrices of Classification Models on The Test Set.

            Model       Actual                                 Predicted
                                        Level 0         Level 1          Level 2        Level 3         Total

                        Level 0           81               39              30             4             154

            CART        Level 1           24               81              18             6             129

                        Level 2           31               54             147             34            266
                        Level 3            6               10              21            121            158
                         Total            142             184             216            165            707

                        Level 0           115              12              12             16            155
             C5.0       Level 1           31              110              29             18            188

                        Level 2           13               27             157             21            218
                        Level 3           18               10              11            117            156
                         Total            177             159             209            172            707

                                        Table 5 Accuracy Metrics of Classification Models.

            Model      Fatality Severity                                                 Overall
                           Level            Precision       Recall       F-measure    Accuracy (%)    Kappa (%)
                           Level 0            0.52           0.57          0.54


            CART           Level 1            0.62           0.44          0.51           60             47
                                                                           0.60
                                              0.55
                           Level 2
                                                             0.68

                           Level 3            0.76           0.73          0.74


                           Level 0            0.74           0.68          0.71
             C5.0          Level 1            0.58           0.69          0.63
                                                                                          70             60
                           Level 2            0.72           0.75          0.73

                           Level 3            0.80           0.68          0.73

               From the non-diagonal elements of the confusion matrices in Table 4 it can be viewed that C5.0 had less wrong predictions
          and according to Table 5, the tree obtained better results in comparison with CART with an overall accuracy of 70% and a kappa
          of 60%. Also the precision and recall values of C5.0 are more than those of CART except in Level 1 and Level 4, which the
          differences are almost negligible. Fig. 4 and Fig. 5 show the risk maps of the classifiers which were produced by the whole
          dataset, so as to inspect the fatality severity distribution throughout the study area.

                                                                                                               6
   603   604   605   606   607   608   609   610   611   612   613