Page 605 - NGTU_paper_withoutVideo
P. 605
Modern Geomatics Technologies and Applications


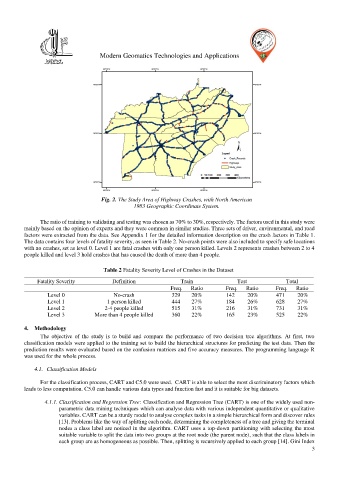
                                     Fig. 2. The Study Area of Highway Crashes, with North American
                                                1983 Geographic Coordinate System.

               The ratio of training to validating and testing was chosen as 70% to 30%, respectively. The factors used in this study were
          mainly based on the opinion of experts and they were common in similar studies. Three sets of driver, environmental, and road
          factors were extracted from the data. See Appendix 1 for the detailed information description on the crash factors in Table 1.
          The data contains four levels of fatality severity, as seen in Table 2. No-crash points were also included to specify safe locations
          with no crashes, set as level 0. Level 1 are fatal crashes with only one person killed. Levels 2 represents crashes between 2 to 4
          people killed and level 3 hold crashes that has caused the death of more than 4 people.

                                     Table 2 Fatality Severity Level of Crashes in the Dataset

              Fatality Severity         Definition              Train               Test             Total

                                                             Freq.      Ratio   Freq.      Ratio   Freq.      Ratio

                  Level 0                No-crash            329        20%     142         20%   471         20%
                  Level 1              1 person killed       444        27%     184         26%   628         27%
                  Level 2             2-4 people killed      515        31%     216         31%   731         31%
                  Level 3         More than 4 people killed   360        22%    165         23%   525         22%

          4.  Methodology
               The  objective  of  the  study  is  to  build  and  compare  the  performance  of  two  decision  tree  algorithms.  At  first,  two
          classification models were applied to the training set to build the hierarchical structures for predicting the test data. Then the
          prediction results were evaluated based on the confusion matrices and five accuracy measures. The programming language R
          was used for the whole process.

             4.1.  Classification Models

               For the classification process, CART and C5.0 were used.  CART is able to select the most discriminatory factors which
          leads to less computation. C5.0 can handle various data types and function fast and it is suitable for big datasets.

                 4.1.1. Classification and Regression Tree: Classification and Regression Tree (CART) is one of the widely used non-
                      parametric data mining techniques which can analyse data with various independent quantitative or qualitative
                      variables. CART can be a sturdy model to analyse complex tasks in a simple hierarchical form and discover rules
                      [13]. Problems like the way of splitting each node, determining the completeness of a tree and giving the terminal
                      nodes a class label are noticed in the algorithm. CART uses a top-down partitioning with selecting the most
                      suitable variable to split the data into two groups at the root node (the parent node), such that the class labels in
                      each group are as homogeneous as possible. Then, splitting is recursively applied to each group [14]. Gini Index
                                                                                                               3

