Page 607 - NGTU_paper_withoutVideo
P. 607

Modern Geomatics Technologies and Applications

               Overall  accuracy  is  the  proportion  of  correctly  classified  samples  among  all     predicted  samples.  It  indicates  the
          classifier’s quality to correctly identify samples, as shown in (4) [18]:

                  +    +    +   
               =                                                                                                                                                                                                     (4)
                      

               Kappa is an agreement measure between observed and predicted classes for cases in the test set, ranging from -1 to 1. It
          can be calculated via (5) [18]:

                     × ∑ 4       − ∑ 4                           
                                 
                     =    =1        =1        ,                                                                                                                                             (5)
                        2
                          − ∑ 4   =1                           

          where       are the diagonal elements of the confusion matrix.
                      

               Given all the predicted labels for Class   , precision of the class determines the number of correctly classified samples,
          using the following (6) [20]:

                                
                                   =                                                                                                                                                                                          (6)
                                   

               Moreover, class recall is the ratio of correctly classified samples divided by the number of samples in the actual class.
          The formula is given in (7) [20]:

                            
                             =                                                                                                                                                                                                   (7)
                              

               F-measure or F-score is the harmonic mean of Precision and Recall. It ranges from 0 to the optimal value 1, using the
          following (9) [21]:

                                                ×                  
                                         
             −                      = 2 ×                                                                                                                                                (8)
                                                +                  
                                         
          5.  Experimental Results
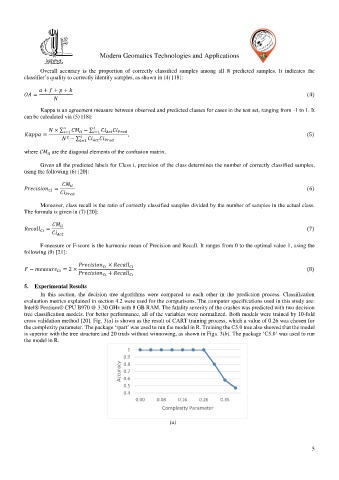
               In  this  section,  the  decision  tree  algorithms  were  compared  to  each  other  in  the  prediction  process.  Classification
          evaluation metrics explained in section 4.2 were used for the comparisons. The computer specifications used in this study are:
          Intel® Pentium® CPU B970 @ 3.30 GHz with 8 GB RAM. The fatality severity of the crashes was predicted with two decision
          tree classification models. For better performance, all of the variables were normalized. Both models were trained by 10-fold
          cross validation method [20]. Fig. 3(a) is shown as the result of CART training process, which a value of 0.26 was chosen for
          the complexity parameter. The package ‘rpart’ was used to run the model in R. Training the C5.0 tree also showed that the model
          is superior with the tree structure and 20 trials without winnowing, as shown in Figs. 3(b). The package ‘C5.0’ was used to run
          the model in R.
                                              1
                                            0.9
                                           Accuracy  0.7
                                            0.8
                                            0.6
                                            0.5
                                            0.4
                                                 0.00   0.08    0.16   0.26   0.35
                                                          Complexity Parameter

                                                               (a)


                                                                                                               5
   602   603   604   605   606   607   608   609   610   611   612