
Page 28 - Апрель
P. 28
METALWORKING EQUIPMENT AND TOOLS
The example in Fig. 4 shows how the amplitudes of the VA signal increase during self-
oscillations. This makes it possible to quite simply identify the moments of occurrence of this
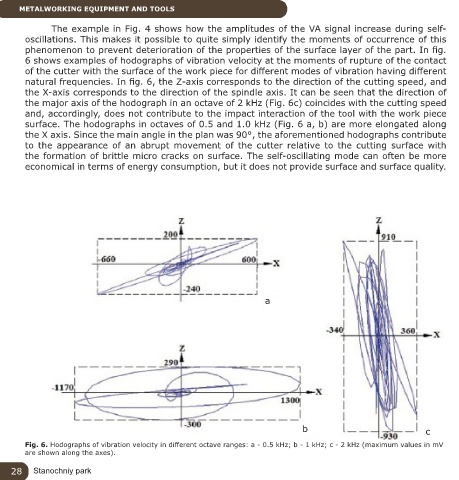
phenomenon to prevent deterioration of the properties of the surface layer of the part. In fig.
6 shows examples of hodographs of vibration velocity at the moments of rupture of the contact
of the cutter with the surface of the work piece for different modes of vibration having different
natural frequencies. In fig. 6, the Z-axis corresponds to the direction of the cutting speed, and
the X-axis corresponds to the direction of the spindle axis. It can be seen that the direction of
the major axis of the hodograph in an octave of 2 kHz (Fig. 6c) coincides with the cutting speed
and, accordingly, does not contribute to the impact interaction of the tool with the work piece
surface. The hodographs in octaves of 0.5 and 1.0 kHz (Fig. 6 a, b) are more elongated along
the X axis. Since the main angle in the plan was 90°, the aforementioned hodographs contribute
to the appearance of an abrupt movement of the cutter relative to the cutting surface with
the formation of brittle micro cracks on surface. The self-oscillating mode can often be more
economical in terms of energy consumption, but it does not provide surface and surface quality.
a
b c
Fig. 6. Hodographs of vibration velocity in different octave ranges: a - 0.5 kHz; b - 1 kHz; c - 2 kHz (maximum values in mV
are shown along the axes).
28 Stanochniy park