
Page 23 - BBLP ejournal2018.docx
P. 23
Journal of Biotechnology in Livestock Production
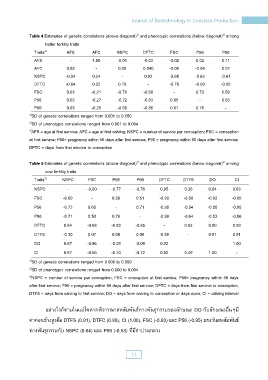
Table 4 Estimates of genetic correlations (above diagonal) and phenotypic correlations (below diagonal) among
1/
2/
heifer fertility traits
Traits 3/ AFS AFC NSPC DFTC FSC P56 P90
AFS - 1.00 -0.01 -0.03 -0.02 0.02 0.11
AFC 0.93 - 0.09 0.040 -0.08 -0.04 0.07
NSPC -0.04 0.24 - 0.93 -0.65 -0.63 -0.61
DFTC -0.04 0.32 0.78 - -0.76 -0.99 -0.99
FSC 0.03 -0.21 -0.76 -0.68 - 0.73 0.59
P56 0.03 -0.27 -0.72 -0.83 0.65 - 0.83
P90 0.03 -0.28 -0.66 -0.86 0.51 0.78 -
1/ SD of genetic correlations ranged from 0.001 to 0.150
2/ SD of phenotypic correlations ranged from 0.001 to 0.004
3/ AFS = age at first service; AFC = age at first calving; NSPC = number of service per conception; FSC = conception
at first service; P56= pregnancy within 56 days after first service; P90 = pregnancy within 90 days after first service;
DFTC = days from first service to conception
Table 5 Estimates of genetic correlations (above diagonal) and phenotypic correlations (below diagonal) among
1/
2/
cow fertility traits
Traits 3/ NSPC FSC P56 P90 DFTC DTFS DO CI
NSPC - -0.80 -0.77 -0.76 0.95 0.36 0.64 0.63
FSC -0.69 - 0.59 0.51 -0.93 -0.58 -0.93 -0.85
P56 -0.73 0.65 - 0.71 -0.99 -0.54 -0.80 -0.95
P90 -0.71 0.50 0.76 - -0.99 -0.64 -0.53 -0.96
DFTC 0.84 -0.68 -0.83 -0.85 - 0.63 0.90 0.89
DTFS -0.10 0.07 0.06 0.06 -0.89 - 0.91 0.91
DO 0.67 -0.56 -0.08 -0.09 0.82 1.00
CI 0.67 -0.55 -0.70 -0.72 0.82 0.49 1.00 -
1/ SD of genetic correlations ranged from 0.000 to 0.099
2/ SD of phenotypic correlations ranged from 0.000 to 0.004
3/ NSPC = number of service per conception; FSC = conception at first service; P56= pregnancy within 56 days
after first service; P90 = pregnancy within 90 days after first service; DFTC = days from first service to conception;
DTFS = days from calving to first service; DO = days from calving to conception or days open; CI = calving interval
อย่างไรก็ตามในแม่โคหากพิจารณาสหสัมพันธ์ทางพันธุกรรมของลักษณะ DO กับลักษณะอื่นๆมี
ค่าค่อนข้างสูงคือ DTFS (0.91), DTFC (0.90), CI (1.00), FSC (-0.93) และ P56 (-0.95) ยกเว้นสหสัมพันธ์
ทางพันธุกรรมกับ NSPC (0.64) และ P90 (-0.53) ที่มีค่าปานกลาง
13