
Page 41 - 2022 - annual report
P. 41
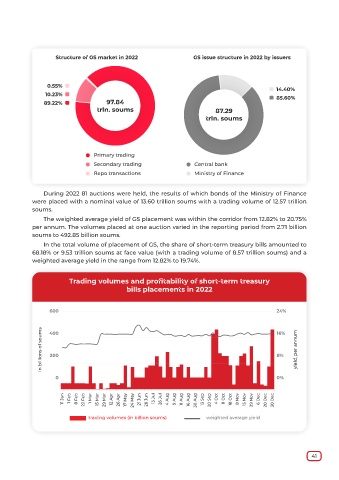
Structure of GS market in 2022                  GS issue structure in 2022 by issuers


                  0.55%  ⏹
                                                                                                ⏹  14.40%
                 10.23%  ⏹                                                                      ⏹  85.60%
                89.22%  ⏹             97.84
                                   trln. soums                               87.29
                                                                         trln. soums


                               ⚪  Primary trading
                               ⚪  Secondary trading                ⚪  Central bank
                               ⚪  Repo transactions                ⚪  Ministry of Finance


                During 2022 81 auctions were held, the results of which bonds of the Ministry of Finance
            were placed with a nominal value of 13.60 trillion soums with a trading volume of 12.57 trillion
            soums.
                The weighted average yield of GS placement was within the corridor from 12.82% to 20.75%
            per annum. The volumes placed at one auction varied in the reporting period from 2.71 billion
            soums to 492.85 billion soums.
                In the total volume of placement of GS, the share of short-term treasury bills amounted to
            68.18% or 9.53 trillion soums at face value (with a trading volume of 8.57 trillion soums) and a
            weighted average yield in the range from 12.82% to 19.74%.


                         Trading volumes and profitability of short-term treasury
                                             bills placements in 2022


                  600                                                                             24%


                in billions of soums  400                                                         16%    yield, per annum


                                                                                                  8%
                   200


                     0                                                                            0%


                       11 Jan  1 Feb  8 Feb  22 Feb  1 Mar  15 Mar  29 Mar  12 Apr  26 Apr  17 May  24 May  21 Jun  28 Jun  13 Jul  26 Jul  4 Aug  9 Aug  11 Aug  16 Aug  30 Aug  13 Sep  20 Sep  4 Oct  11 Oct  18 Oct  8 Nov  15 Nov  29 Nov  6 Dec  20 Dec  30 Dec


                                trading volumes (in billion soums)       weighted average yield


                                                                                                              41