
Page 91 - Human Umbilical Cord Mesenchymal Stem Cells
P. 91
Shu et al. Stem Cell Research & Therapy (2020) 11:361 Page 5 of 11
discharge from the hospital [27]. In our study, the Results
NEWS2 score and seven-category ordinal scale were hUC-MSC treatment procedure and general patient
used to assess the clinical symptoms and conditions of information
the enrolled patients [28]. The secondary clinical out- This study was conducted from February 12, 2020, to
comes included patient status at days 7 and 14 assessed March 25, 2020. A total of 12 patients were enrolled in
with a seven-category ordinal scale, hospital stay, the hUC-MSC treatment group, and 29 patients were
changes in oxygenation index, hematological inflamma- enrolled in the control group (Fig. 1). The median age of
tory factors, and imaging. the patients was 61 years old (interquartile range [IQR],
50 to 70.5 years, with a median of 65 years in the hUC-
Statistical analysis MSC group vs. 58 years in the control group, P = 0.576),
Continuous variables with a normal distribution are and 58.54% of the total patients were men (66.67% in
expressed as the mean ± standard deviation (SD); nonnor- the hUC-MSC group vs. 55.17% in the control group,
mally distributed continuous variables are reported as the P = 0.794, Table 1). The median time from onset of
median (interquartile range, IQR). For the P value, the symptoms to enrollment was 13 days (11.5 days in the
Mann-Whitney U test was used to analyze normally dis- hUC-MSC group vs. 14 days in the control group, P =
tributed continuous variables, and the Kruskal-Wallis test 0.135, Table 2). There were no significant differences be-
was used for nonnormally distributed data. Categorical tween the hUC-MSC treatment and control groups in
variables were presented as percentages and analyzed by terms of demographic characteristics, laboratory test re-
the chi-square test or Wilcoxon rank-sum test. All statis- sults, distribution of sequential scale scores, or NEWS2
tical analyses were performed with Stata version 14.2 for scores at enrollment. In the trial, all patients used anti-
Mac (StataCorp, College Station, TX), and a P value less viral drugs for 7 to 10 days, and systemic glucocorticoids
than 0.05 was considered statistically significant. were also used for a median of 5 days (7.5 days in the
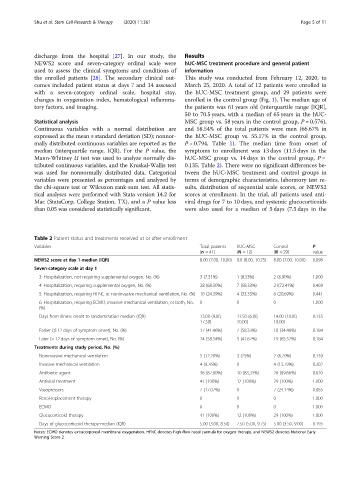
Table 2 Patient status and treatments received at or after enrollment
Variables Total patients hUC-MSC Control P
(n = 41) (N = 12) (N = 29) value
NEWS2 score at day 1-median (IQR) 8.00 (7.00, 10.00) 9.0 (8.00, 10.75) 8.00 (7.00, 10.00) 0.098
Seven-category scale at day 1
3: Hospitalization, not requiring supplemental oxygen, No. (%) 3 (7.31%) 1 (8.33%) 2 (6.90%) 1.000
4: Hospitalization, requiring supplemental oxygen, No. (%) 28 (68.30%) 7 (58.33%) 21(72.41%) 0.469
5: Hospitalization, requiring HFNC or noninvasive mechanical ventilation, No. (%) 10 (24.39%) 4 (33.33%) 6 (20.69%) 0.441
6: Hospitalization, requiring ECMO, invasive mechanical ventilation, or both, No. 0 0 0 1.000
(%)
Days from illness onset to randomization median (IQR) 13.00 (9.00, 11.50 (6.00, 14.00 (10.00, 0.135
17.50) 20.00) 18.00)
Earlier (≤ 12 days of symptom onset), No. (%) 17 (41.46%) 7 (58.33%) 10 (34.48%) 0.184
Later (> 12 days of symptom onset), No. (%) 24 (58.54%) 5 (41.67%) 19 (65.52%) 0.184
Treatments during study period, No. (%)
Noninvasive mechanical ventilation 5 (12.20%) 3 (25%) 2 (6.70%) 0.139
Invasive mechanical ventilation 4 (9.76%) 0 4 (13.79%) 0.302
Antibiotic agent 36 (87.80%) 10 (83.33%) 26 (89.66%) 0.620
Antiviral treatment 41 (100%) 12 (100%) 29 (100%) 1.000
Vasopressors 7 (17.07%) 0 7 (24.14%) 0.085
Renal-replacement therapy 0 0 0 1.000
ECMO 0 0 0 1.000
Glucocorticoid therapy 41 (100%) 12 (100%) 29 (100%) 1.000
Days of glucocorticoid therapy-median (IQR) 5.00 (3.00, 8.50) 7.50 (5.00, 9.75) 5.00 (3.50, 9.00) 0.195
Notes: ECMO denotes extracorporeal membrane oxygenation, HFNC denotes high-flow nasal cannula for oxygen therapy, and NEWS2 denotes National Early
Warning Score 2