
Page 90 - Human Umbilical Cord Mesenchymal Stem Cells
P. 90
Shu et al. Stem Cell Research & Therapy (2020) 11:361 Page 4 of 11
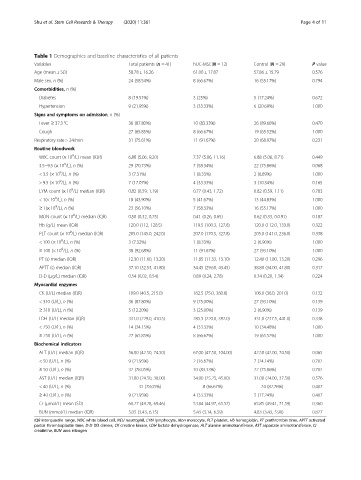
Table 1 Demographics and baseline characteristics of all patients
Variables Total patients (n = 41) hUC-MSC(N = 12) Control (N = 29) P value
Age (mean ± SD) 58.78 ± 16.26 61.00 ± 17.87 57.86 ± 15.79 0.576
Male sex, n (%) 24 (58.54%) 8 (66.67%) 16 (55.17%) 0.794
Comorbidities, n (%)
Diabetes 8 (19.51%) 3 (25%) 5 (17.24%) 0.672
Hypertension 9 (21.95%) 3 (33.33%) 6 (20.69%) 1.000
Signs and symptoms on admission, n (%)
Fever ≥ 37.3 °C 36 (87.80%) 10 (83.33%) 26 (89.66%) 0.470
Cough 27 (65.85%) 8 (66.67%) 19 (65.52%) 1.000
Respiratory rate > 24/min 31 (75.61%) 11 (91.67%) 20 (68.97%) 0.231
Routine bloodwork
9
WBC count (× 10 /L) mean (IQR) 6.88 (5.06, 9.20) 7.37 (5.06, 11.16) 6.88 (5.06, 8.71) 0.449
9
3.5~9.5 (× 10 /L), n (%) 29 (70.73%) 7 (58.34%) 22 (75.86%) 0.068
9
< 3.5 (× 10 /L), n (%) 3 (7.31%) 1 (8.33%) 2 (6.89%) 1.000
9
> 9.5 (× 10 /L), n (%) 7 (17.07%) 4 (33.33%) 3 (10.34%) 0.165
9
LYM count (× 10 /L) median (IQR) 0.82 (0.59, 1.19) 0.77 (0.43, 1.72) 0.82 (0.59, 1.11) 0.783
9
< 1(× 10 /L), n (%) 18 (43.90%) 5 (41.67%) 13 (44.83%) 1.000
9
≥ 1(× 10 /L), n (%) 23 (56.10%) 7 (58.33%) 16 (55.17%) 1.000
9
MON count (× 10 /L) median (IQR) 0.50 (0.32, 0.75) 0.41 (0.26, 0.65) 0.62 (0.33, 0.0.91) 0.187
Hb (g/L) mean (IQR) 120.0 (112, 128.5) 119.5 (100.3, 127.8) 120.0 (112.0, 133.0) 0.322
9
PLT count (× 10 /L) median (IQR) 205.0 (145.0, 242.0) 207.0 (170.5, 327.8) 205.0 (141.0, 236.0) 0.338
9
< 100 (× 10 /L), n (%) 3 (7.32%) 1 (8.33%) 2 (6.90%) 1.000
9
≥ 100 (× 10 /L), n (%) 38 (92.68%) 11 (91.67%) 27 (93.10%) 1.000
PT (s) median (IQR) 12.30 (11.60, 13.20) 11.85 (11.33, 13.10) 12.40 (11.80, 13.20) 0.296
APTT (s) median (IQR) 37.10 (32.53, 41.80) 34.45 (29.60, 43.45) 38.80 (34.00, 41.80) 0.317
D-D (μg/L) median (IQR) 0.54 (0.02, 0.54) 0.89 (0.24, 2.78) 0.34 (0.20, 1.34) 0.224
Myocardial enzymes
CK (U/L) median (IQR) 109.0 (40.5, 215.0) 162.5 (75.0, 360.8) 106.0 (36.0, 201.0) 0.132
< 310 (U/L), n (%) 36 (87.80%) 9 (75.00%) 27 (93.10%) 0.139
≥ 310 (U/L), n (%) 5 (12.20%) 3 (25.00%) 2 (6.90%) 0.139
LDH (U/L) median (IQR) 331.0 (229.0, 410.5) 285.5 (220.0, 392.0) 331.0 (237.5, 441.0) 0.338
< 250 (U/L), n (%) 14 (34.15%) 4 (33.33%) 10 (34.48%) 1.000
≥ 250 (U/L), n (%) 27 (65.85%) 8 (66.67%) 19 (65.52%) 1.000
Biochemical indicators
ALT (U/L) median (IQR) 56.00 (42.50, 74.50) 67.00 (47.50, 104.00) 42.50 (42.00, 74.50) 0.065
< 50 (U/L), n (%) 9 (21.95%) 2 (16.67%) 7 (24.14%) 0.702
≥ 50 (U/L), n (%) 32 (78.05%) 10 (83.33%) 22 (75.86%) 0.702
AST (U/L) median (IQR) 31.00 (24.50, 38.00) 34.00 (25.25, 45.00) 31.00 (24.00, 37.50) 0.576
< 40 (U/L), n (%) 32 (78.05%) 8 (66.67%) 24 (82.76%) 0.407
≥ 40 (U/L), n (%) 9 (21.95%) 4 (33.33%) 5 (17.24%) 0.407
Cr (μmol/L) mean (SD) 60.27 (49.28, 69.46) 53.84 (44.97, 65.57) 65.85 (49.41, 71.59) 0.360
BUN (mmol/L) median (IQR) 5.05 (3.43, 6.15) 5.43 (3.14, 6.59) 4.83 (3.43, 5.90) 0.827
IQR interquartile range, WBC white blood cell, NEU neutrophil, LYM lymphocyte, Mon monocyte, PLT platelet, Hb hemoglobin, PT prothrombin time, APTT activated
partial thromboplastin time, D-D DD dimers, CK creatine kinase, LDH lactate dehydrogenase, ALT alanine aminotransferase, AST aspartate aminotransferase, Cr
creatinine, BUN urea nitrogen