
Page 92 - Human Umbilical Cord Mesenchymal Stem Cells
P. 92
Shu et al. Stem Cell Research & Therapy (2020) 11:361 Page 6 of 11
hUC-MSC group vs. 5 days in the control group, P = control group (median, 9.0 days in the hUC-MSC group
0.195, Table 2). vs. 14.0 days in the control group, P = 0.006). In the age ≤
65 years subgroup, the time to improvement in the
Primary outcome hUC-MSC treatment group was 6.0 days (3.00, 7.00) vs.
In the hUC-MSC treatment group, all patients improved 12 days (7.25, 15.50) in the control group. In the age >
and were discharged, and no invasive ventilation oc- 65 years subgroup, the time to clinical improvement was
curred in 12 patients. The incidence of progression from significantly prolonged in both groups: 13 days (11.75,
severe to critical illness and the 28-day mortality rate 14.00) in the hUC-MSC treatment group vs. 23 days
were 0, while 4 patients in the control group deterio- (18.50, 29.00) in the control group. Symptoms of weak-
rated to critical illness and received invasive ventilation. ness and fatigue, shortness of breath, and low oxygen
Three of them died, and the 28-day mortality rate was saturation obviously improved in the hUC-MSC group
10.34%. The time to clinical improvement in the hUC- compared with the control group. On day 3 of infusion,
MSC treatment group was shorter than that in the 2 patients (16.67%) in the hUC-MSC group had a
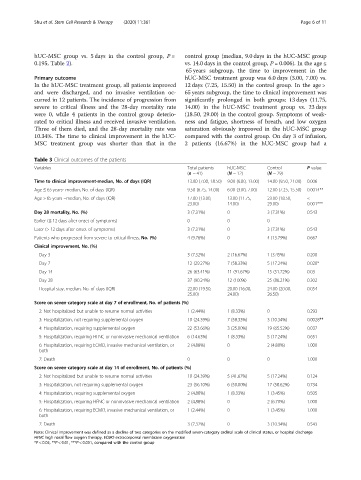
Table 3 Clinical outcomes of the patients
Variables Total patients hUC-MSC Control P value
(n = 41) (N = 12) (N = 29)
Time to clinical improvement-median, No. of days (IQR) 13.00 (7.00, 18.50) 9.00 (6.00, 13.00) 14.00 (9.50, 21.00) 0.006
Age ≤ 65 years- median, No. of days (IQR) 9.50 (6.75, 14.00) 6.00 (3.00, 7.00) 12.00 (7.25, 15.50) 0.0014**
Age > 65 years –median, No. of days (IQR) 17.00 (13.00, 13.00 (11.75, 23.00 (18.50, <
23.00) 14.00) 29.00) 0.001***
Day 28 mortality, No. (%) 3 (7.31%) 0 3 (7.31%) 0.543
Earlier (≤ 12 days after onset of symptoms) 0 0 0
Later (> 12 days after onset of symptoms) 3 (7.31%) 0 3 (7.31%) 0.543
Patients who progressed from severe to critical illness, No. (%) 4 (9.76%) 0 4 (13.79%) 0.667
Clinical improvement, No. (%)
Day 3 3 (7.32%) 2 (16.67%) 1 (3.45%) 0.200
Day 7 12 (29.27%) 7 (58.33%) 5 (17.24%) 0.020*
Day 14 26 (63.41%) 11 (91.67%) 15 (51.72%) 0.03
Day 28 37 (90.24%) 12 (100%) 25 (86.21%) 0.302
Hospital stay, median, No. of days (IQR) 22.00 (19.50, 20.00 (16.00, 24.00 (20.00, 0.054
25.00) 24.00) 26.50)
Score on seven-category scale at day 7 of enrollment, No. of patients (%)
2: Not hospitalized but unable to resume normal activities 1 (2.44%) 1 (8.33%) 0 0.293
3: Hospitalization, not requiring supplemental oxygen 10 (24.39%) 7 (58.33%) 3 (10.34%) 0.0028**
4: Hospitalization, requiring supplemental oxygen 22 (53.66%) 3 (25.00%) 19 (65.52%) 0.037
5: Hospitalization, requiring HFNC or noninvasive mechanical ventilation 6 (14.63%) 1 (8.33%) 5 (17.24%) 0.651
6: Hospitalization, requiring ECMO, invasive mechanical ventilation, or 2 (4.88%) 0 2 (4.88%) 1.000
both
7: Death 0 0 0 1.000
Score on seven-category scale at day 14 of enrollment, No. of patients (%)
2: Not hospitalized but unable to resume normal activities 10 (24.39%) 5 (41.67%) 5 (17.24%) 0.124
3: Hospitalization, not requiring supplemental oxygen 23 (56.10%) 6 (50.00%) 17 (58.62%) 0.734
4: Hospitalization, requiring supplemental oxygen 2 (4.88%) 1 (8.33%) 1 (3.45%) 0.505
5: Hospitalization, requiring HFNC or noninvasive mechanical ventilation 2 (4.88%) 0 2 (6.70%) 1.000
6: Hospitalization, requiring ECMO, invasive mechanical ventilation, or 1 (2.44%) 0 1 (3.45%) 1.000
both
7: Death 3 (7.32%) 0 3 (10.34%) 0.543
Note: Clinical improvement was defined as a decline of two categories on the modified seven-category ordinal scale of clinical status, or hospital discharge
HFNC high nasal flow oxygen therapy, ECMO extracorporeal membrane oxygenation
*P < 0.05, **P < 0.01, ***P < 0.001, compared with the control group