
Page 128 - Draft
P. 128
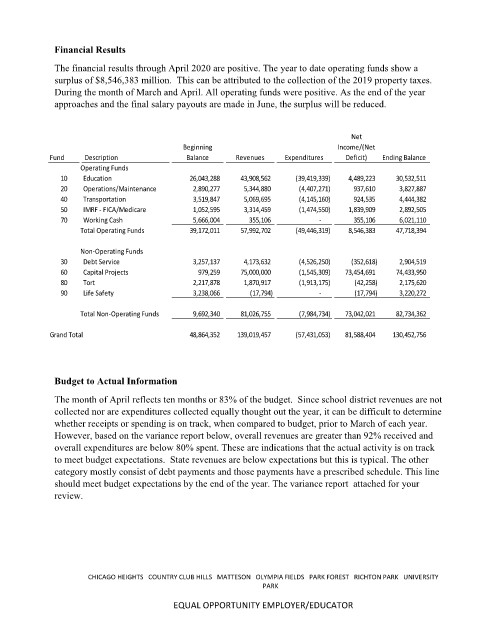
Financial Results

               The financial results through April 2020 are positive. The year to date operating funds show a
               surplus of $8,546,383 million.  This can be attributed to the collection of the 2019 property taxes.
               During the month of March and April. All operating funds were positive. As the end of the year
               approaches and the final salary payouts are made in June, the surplus will be reduced.


                                                                                        Net
                                              Beginning                              Income/(Net
             Fund      Description             Balance     Revenues     Expenditures   Deficit)  Ending Balance
                     Operating Funds
                10    Education                          26,043,288           43,908,562              (39,419,339)          4,489,223            30,532,511
                20    Operations/Maintenance                2,890,277              5,344,880                 (4,407,271)              937,610               3,827,887
                40    Transportation                       3,519,847              5,069,695                 (4,145,160)              924,535               4,444,382
                50    IMRF - FICA/Medicare                 1,052,595              3,314,459                 (1,474,550)          1,839,909               2,892,505
                70    Working Cash                         5,666,004                 355,106                               -               355,106               6,021,110
                     Total Operating Funds               39,172,011           57,992,702              (49,446,319)       8,546,383                     47,718,394

                     Non-Operating Funds
                30    Debt Service                         3,257,137              4,173,632                 (4,526,250)            (352,618)               2,904,519
                60    Capital Projects                         979,259           75,000,000                 (1,545,309)        73,454,691            74,433,950
                80    Tort                                 2,217,878              1,870,917                 (1,913,175)              (42,258)               2,175,620
                90    Life Safety                          3,238,066                  (17,794)                              -               (17,794)               3,220,272


                     Total Non-Operating Funds                9,692,340           81,026,755                 (7,984,734)       73,042,021                   82,734,362

             Grand Total                                 48,864,352         139,019,457              (57,431,053)       81,588,404                 130,452,756


               Budget to Actual Information

               The month of April reflects ten months or 83% of the budget.  Since school district revenues are not
               collected nor are expenditures collected equally thought out the year, it can be difficult to determine
               whether receipts or spending is on track, when compared to budget, prior to March of each year.
               However, based on the variance report below, overall revenues are greater than 92% received and
               overall expenditures are below 80% spent. These are indications that the actual activity is on track
               to meet budget expectations.  State revenues are below expectations but this is typical. The other
               category mostly consist of debt payments and those payments have a prescribed schedule. This line
               should meet budget expectations by the end of the year. The variance report  attached for your
               review.


                       CHICAGO HEIGHTS   COUNTRY CLUB HILLS   MATTESON   OLYMPIA FIELDS   PARK FOREST   RICHTON PARK   UNIVERSITY
                                                                  PARK

                                            EQUAL OPPORTUNITY EMPLOYER/EDUCATOR