
Page 202 - Draft
P. 202
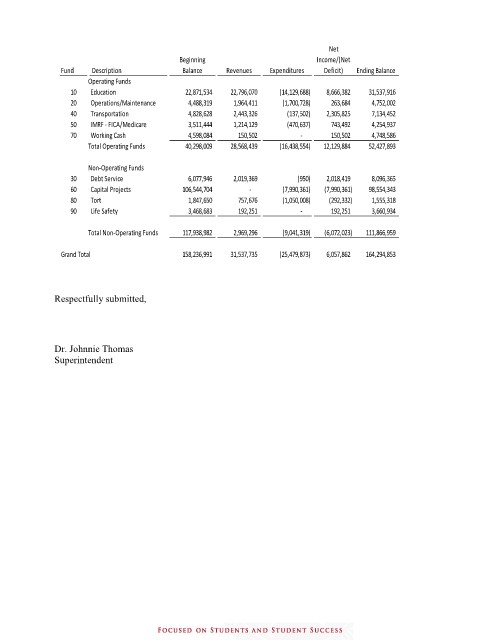
Net

                                             Beginning                          Income/(Net
                Fund    Description           Balance    Revenues   Expenditures  Deficit)  Ending Balance
                       Operating Funds
                   10  Education                        22,871,534           22,796,070              (14,129,688)          8,666,382            31,537,916

                   20  Operations/Maintenance                4,488,319              1,964,411                 (1,700,728)              263,684               4,752,002
                   40  Transportation                     4,828,628              2,443,326                    (137,502)          2,305,825               7,134,452
                   50  IMRF - FICA/Medicare                3,511,444              1,214,129                    (470,637)              743,492               4,254,937
                   70  Working Cash                       4,598,084                 150,502                               -               150,502               4,748,586

                       Total Operating Funds              40,298,009           28,568,439              (16,438,554)       12,129,884                   52,427,893
                       Non-Operating Funds

                   30  Debt Service                       6,077,946              2,019,369                             (950)          2,018,419               8,096,365
                   60  Capital Projects              106,544,704                          -                 (7,990,361)        (7,990,361)            98,554,343
                   80  Tort                               1,847,650                 757,676                 (1,050,008)            (292,332)               1,555,318
                   90  Life Safety                        3,468,683                 192,251                               -               192,251               3,660,934

                       Total Non-Operating Funds           117,938,982              2,969,296                 (9,041,319)       (6,072,023)                 111,866,959

                Grand Total                          158,236,991           31,537,735              (25,479,873)       6,057,862                   164,294,853


               Respectfully submitted,


               Dr. Johnnie Thomas
               Superintendent