
Page 241 - draft
P. 241
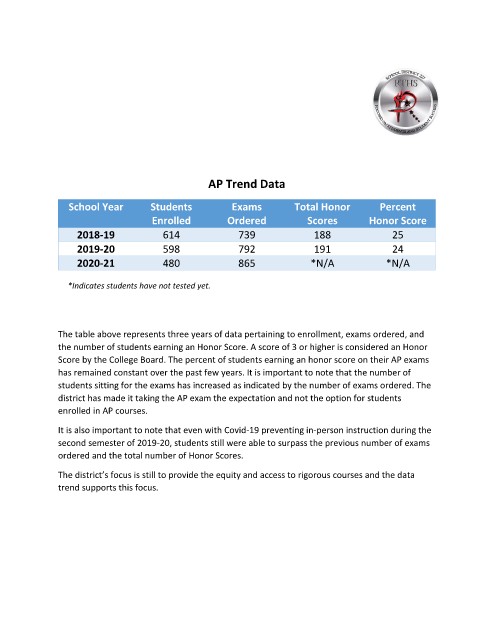
AP Trend Data

                  School Year         Students            Exams           Total Honor          Percent
                                       Enrolled          Ordered             Scores         Honor Score

                    2018-19              614                739                188                25
                    2019-20              598                792                191                24
                    2020-21              480                865               *N/A               *N/A

                  *Indicates students have not tested yet.


               The table above represents three years of data pertaining to enrollment, exams ordered, and
               the number of students earning an Honor Score. A score of 3 or higher is considered an Honor
               Score by the College Board. The percent of students earning an honor score on their AP exams
               has remained constant over the past few years. It is important to note that the number of
               students sitting for the exams has increased as indicated by the number of exams ordered. The
               district has made it taking the AP exam the expectation and not the option for students
               enrolled in AP courses.

               It is also important to note that even with Covid-19 preventing in-person instruction during the
               second semester of 2019-20, students still were able to surpass the previous number of exams
               ordered and the total number of Honor Scores.

               The district’s focus is still to provide the equity and access to rigorous courses and the data
               trend supports this focus.