
Page 32 - Towards A Sustainable Future , Phase 3 2025, E-Book_Neat
P. 32
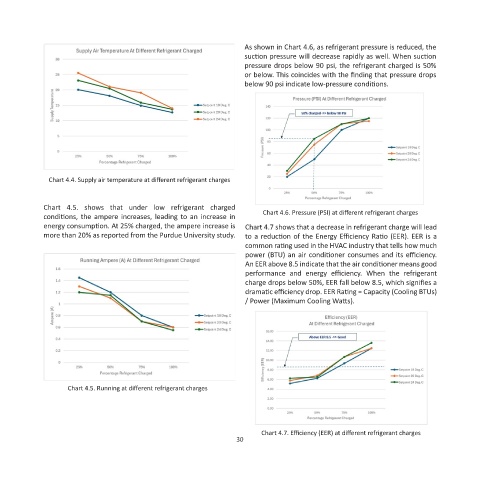
As shown in Chart 4.6, as refrigerant pressure is reduced, the
                                                                 suction pressure will decrease rapidly as well. When suction
                                                                 pressure drops below 90 psi, the refrigerant charged is 50%
                                                                 or below. This coincides with the finding that pressure drops
                                                                 below 90 psi indicate low-pressure conditions.


              Chart 4.4. Supply air temperature at different refrigerant charges


            Chart  4.5.  shows  that  under  low  refrigerant  charged   Chart 4.6. Pressure (PSI) at different refrigerant charges
            conditions, the ampere increases, leading to an increase in
            energy consumption. At 25% charged, the ampere increase is   Chart 4.7 shows that a decrease in refrigerant charge will lead
            more than 20% as reported from the Purdue University study.  to a reduction of the Energy Efficiency Ratio (EER). EER is a
                                                                 common rating used in the HVAC industry that tells how much
                                                                 power (BTU) an air conditioner consumes and its efficiency.
                                                                 An EER above 8.5 indicate that the air conditioner means good
                                                                 performance  and  energy  efficiency.  When  the  refrigerant
                                                                 charge drops below 50%, EER fall below 8.5, which signifies a
                                                                 dramatic efficiency drop. EER Rating = Capacity (Cooling BTUs)
                                                                 / Power (Maximum Cooling Watts).


                   Chart 4.5. Running at different refrigerant charges


                                                                     Chart 4.7. Efficiency (EER) at different refrigerant charges
                                                              30