
Page 205 - 100 Great Business Ideas: From Leading Companies Around the World (100 Great Ideas)
P. 205
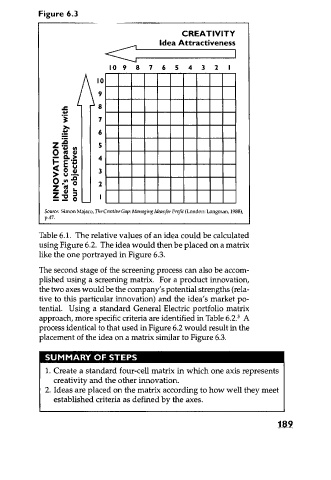
Figure 6.3

                                CREATIVITY
                       Idea Attractiveness

                 I0 9  7654321
            I0
Z           9
Q atar      8
            7
     0. >   6
            5
   E        4
            3
• u0 .475.  2
O .0 0
Z
Z 'a 0

Source: Simon Majaro, The Creative Gap: Managing Ideas for Profit (London: Longman, 1988),
p.47.

Table 6.1. The relative values of an idea could be calculated
using Figure 6.2. The idea would then be placed on a matrix
like the one portrayed in Figure 6.3.

The second stage of the screening process can also be accom-
plished using a screening matrix. For a product innovation,
the two axes would be the company's potential strengths (rela-
tive to this particular innovation) and the idea's market po-
tential. Using a standard General Electric portfolio matrix
approach, more specific criteria are identified in Table 6.2. 3 A
process identical to that used in Figure 6.2 would result in the
placement of the idea on a matrix similar to Figure 6.3.

SUMMARY OF STEPS

1. Create a standard four-cell matrix in which one axis represents
  creativity and the other innovation.

2. Ideas are placed on the matrix according to how well they meet
  established criteria as defined by the axes.