
Page 10 - GurpreetSingh_AnnualReport_Dorel
P. 10
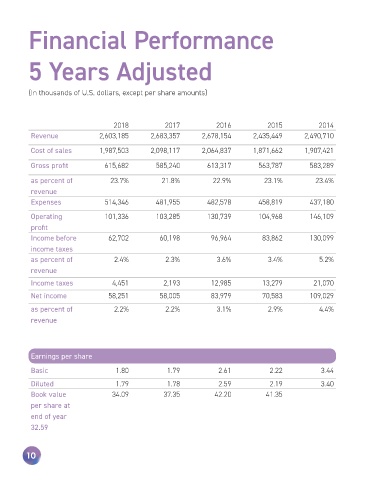
Financial Performance


           5 Years Adjusted


           (In thousands of U.S. dollars, except per share amounts)


                                        2018              2017              2016             2015              2014
            Revenue                2,603,185         2,683,357         2,678,154        2,435,449         2,490,710

            Cost of sales          1,987,503         2,098,117         2,064,837        1,871,662         1,907,421


            Gross profit             615,682           585,240           613,317          563,787           583,289

            as percent of              23.7%              21.8%              22.9%              23.1%              23.4%
            revenue
            Expenses                 514,346           481,955           482,578          458,819           437,180


            Operating                101,336           103,285           130,739          104,968           146,109
            profit
            Income before             62,702              60,198              96,964              83,862    130,099

            income taxes
            as percent of               2.4%                  2.3%               3.6%               3.4%               5.2%
            revenue

            Income taxes                4,451                 2,193              12,985             13,279             21,070

            Net income                58,251              58,005              83,979              70,583    109,029

            as percent of               2.2%                  2.2%               3.1%               2.9%                4.4%
            revenue


            Earnings per share

            Basic                            1.80                1.79               2.61               2.22                3.44

            Diluted                          1.79                1.78               2.59               2.19                3.40
            Book value                      34.09               37.35               42.20               41.35
            per share at

            end of year
            32.59


          10