
Page 145 - YORAM RUDY BOOK FINAL
P. 145
P. 145
5.5 Electrophysiological Substrate of Post Myocardial Infarction Scar 281, 292
Myocardial infarction (MI) triggers a progressive remodeling process that alters the
electrical properties of affected tissue. Alterations include cellular electrophysiological (EP)
remodeling and structural remodeling that involves gap junction changes and regional fibrosis.
Typically, the infarct is a heterogeneous scar, containing islands of excitable myocardium with
altered EP and structural properties (the border zone [BZ]). 293,294 As a consequence, conduction of
excitation through the scar is slow and discontinuous. It is reflected in low voltages and
fractionation of scar EGMs, and in late EGM potentials generated by delayed local activation in
the scar. 295-300 These properties have provided the basis for substrate-based ablation strategies in
the treatment of ventricular tachycardia (VT). ECGI was shown to reconstruct the EGM
301
characteristics associated with scar. 268,269
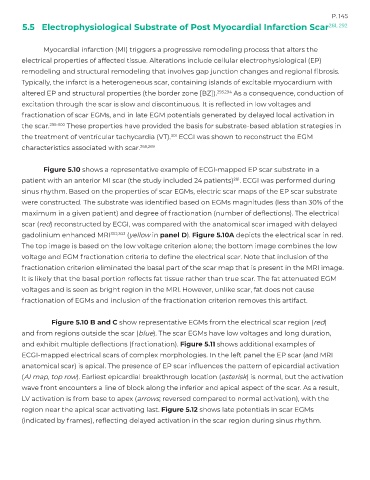
Figure 5.10 shows a representative example of ECGI-mapped EP scar substrate in a
patient with an anterior MI scar (the study included 24 patients) . ECGI was performed during
281
sinus rhythm. Based on the properties of scar EGMs, electric scar maps of the EP scar substrate
were constructed. The substrate was identified based on EGMs magnitudes (less than 30% of the
maximum in a given patient) and degree of fractionation (number of deflections). The electrical
scar (red) reconstructed by ECGI, was compared with the anatomical scar imaged with delayed
gadolinium enhanced MRI 302,303 (yellow in panel D). Figure 5.10A depicts the electrical scar in red.
The top image is based on the low voltage criterion alone; the bottom image combines the low
voltage and EGM fractionation criteria to define the electrical scar. Note that inclusion of the
fractionation criterion eliminated the basal part of the scar map that is present in the MRI image.
It is likely that the basal portion reflects fat tissue rather than true scar. The fat attenuated EGM
voltages and is seen as bright region in the MRI. However, unlike scar, fat does not cause
fractionation of EGMs and inclusion of the fractionation criterion removes this artifact.
Figure 5.10 B and C show representative EGMs from the electrical scar region (red)
and from regions outside the scar (blue). The scar EGMs have low voltages and long duration,
and exhibit multiple deflections (fractionation). Figure 5.11 shows additional examples of
ECGI-mapped electrical scars of complex morphologies. In the left panel the EP scar (and MRI
anatomical scar) is apical. The presence of EP scar influences the pattern of epicardial activation
(AI map, top row). Earliest epicardial breakthrough location (asterisk) is normal, but the activation
wave front encounters a line of block along the inferior and apical aspect of the scar. As a result,
LV activation is from base to apex (arrows; reversed compared to normal activation), with the
region near the apical scar activating last. Figure 5.12 shows late potentials in scar EGMs
(indicated by frames), reflecting delayed activation in the scar region during sinus rhythm.